Redundancy State
In redundancy mode two atvise server instances are synchronously running as a redundant pair. This display gives an overview about the current state of the redundancy. One can distinguish between the two roles "Primary" (=left part of the display) and "Secondary" (=right part of the display). Information about operational mode (redundancy or split mode), network addresses, network configuration and their connection status, the vitality state and the status of the last replication are available. The preferred server can be changed with the button in the area "Preferred". In the field below the status of the last switching is given. The split mode can be switched on/off with the button in the middle of the display.
Active/SOP and Passive/SNOP indicators
The redundancy status of the servers is indicated by "active" or "passive" and supplemented by a numerical vitality status displayed for each server. The active server is defined as the actual operational server. The numerical vitality status is defined as 0 = good and will rise if defined parameters of the vitality table like cpu workload or memory usage get higher.
In split mode the servers are indicated as "SOP" (Split OPerational) or "SNOP" (Split Not OPerational) and operate independently from each other; the redundancy mode is thereby suspended.
Preferred server
The preferred server can only be switched manually using the related button and defines the preferred active server. The switching behavior depends on the actual operation mode. The status of the last switching is shown in the field below.
In redundancy mode the switching will occur in dependency of the vitality status. If the value of the vitality status of the preferred server is equal or less compared to the other server it will become the operational one - indicated as "Active". In split mode the preferred server will always be indicated as "SOP".
Redundancy mode and Split mode
Changing from redundancy to split mode will be done manually using the related button. Re-establishing the redundancy mode will trigger a data replication before the redundancy mode gets finally active. The ongoing replication is represented by green arrows between the servers showing the direction of the replication. The replication is always performed from the SOP respectively active server to the SNOP respectively passive server.
Vitality status, memory and CPU workload
The vitality status shows the overall condition of the particular system. It is determined by the weight of the parametrized (status-)nodes. The total memory and CPU workload of the whole system can also be displayed. For this purpose, the appropriate SNMP data sources and nodes must be added to the project:
Configure SNMP agents on both servers and add the SNMP data source with matching community name to the currently active server (see Add SNMP data source for further information).
Create nodes Information ‣ DIAGNOSTICS ‣ CPU ‣ TotalCPUPercent and Information ‣ DIAGNOSTICS ‣ MEM ‣ TotalMemUsedPercent of data type float or double.
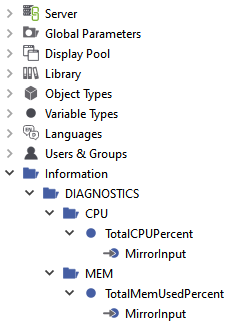
Add mirroring (Input (absolute)) to the nodes and configure the corresponding SNMP OIDs (see also Mirror variables from data sources for further information):
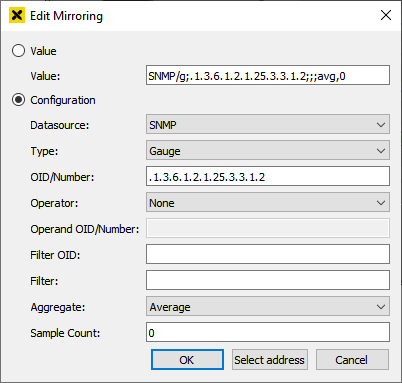
TotalCPUPercent
Data source: SNMP
Type: Gauge
OID: .1.3.6.1.2.1.25.3.3.1.2 (HOST-RESOURCES-MIB::hrProcessorLoad)
Aggregate: Average
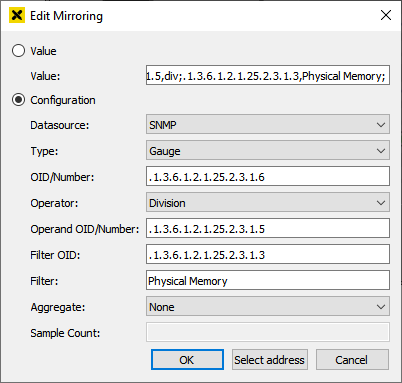
TotalMemUsedPercent
Data source: SNMP
Type: Gauge
OID: .1.3.6.1.2.1.25.2.3.1.6 (HOST-RESOURCES-MIB::hrStorageUsed)
Operator: Division
Operand OID: .1.3.6.1.2.1.25.2.3.1.5 (HOST-RESOURCES-MIB::hrStorageSize)
Filter OID: .1.3.6.1.2.1.25.2.3.1.3 (HOST-RESOURCES-MIB::hrStorageDescr)
Filter: Physical Memory
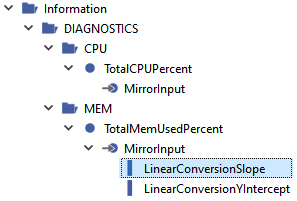
Add linear conversion to mirroring of TotalMemUsedPercent and set value of LinearConversionSlope to 100.
Time delta
The value of the time delta indicates the time deviation between the two servers. If the value is positive, the time of the current server is in front of the time of the second server and vice versa. Example: A value of +10ms on the "Primary" server means, that the time of the server is 10ms in front of the time of the "Secondary" server.
Connection status
The connection status of the network interfaces is represented by color indicated wires and connectors. Currently active connections are represented with a green color. Inactive or not configured connections are represented by grey color. Defective connections are shown red.
Data sources
In the table at the bottom the configured data sources and their active connections are listed. By clicking on the data source name a display with detailed information will be opened.
Overlay
In case of a total connection loss between both servers they are no longer able to exchange the status information and the status information of the other server is therefore no longer valid. This will be indicated by an overlay over the affected elements - the last values will remain visible.
Example: In case the visualization is connected to the Primary and all connections between Primary and Secondary are lost, this will be indicated by an overlay over the Secondary's elements.
Parameters
This control has the following parameters:
Advanced fill color – Fill color of background areas (default: global parameter atvFillColor)
Advanced border color – Color of borders around objects (default: global parameter atvBorderColor)
Advanced symbol color – Color of symbols (default: global parameter atvSymbolColor)
datasource display – Display with detailed information about the respective data source (default: SYSTEM.LIBRARY.ATVISE.OBJECTDISPLAYS.Advanced.hmi.datasource)
message dialog display – Message dialog display (default: SYSTEM.LIBRARY.ATVISE.OBJECTDISPLAYS.Advanced.dialogs.message_dialog)
vitality display – display with information about vitality status (default: SYSTEM.LIBRARY.ATVISE.OBJECTDISPLAYS.Advanced.redundancy.vitality_table)
Font:
Advanced font color – Color which will be applied to labels and values (default: global parameter atvFontColor)