Aggregating data
General
Aggregation is the calculation of so called aggregates like minimum, maximum, average based on raw values or based on already calculated aggregates.
The aggregates used in atvise are based on the OPC UA specification Part 13 "Aggregates" (Release 1.03). For the atvise documentation below parts of that specification where taken by courtesy of the OPC Foundation.
Each aggregate is defined by an interval with the related start and end time and the corresponding aggregate function.
Example:
5-minute minimum
4-hour average
1-day maximum
OPC UA aggregates need "Bounds" (= values at the start timestamp and end timestamp of the interval) for their calculation. Two kinds of calculating bounds exist which are defined by the aggregate function:
Interpolated Bounding Values: using the first value with status Non-Bad before and after the timestamp.
Simple Bounding Values: using the first value before and after the timestamp even if the status is "Bad".
In addition, each aggregate function has the following two settings:
Interpolation: Will be configured for the raw archive and applies to all aggregate functions of an aggregate template due to the assignment of the aggregate template and raw archive to a node.Interpolation will automatically be applied in case a value exists before and after the timestamp (start time or end time).
Extrapolation: Will be configured directly for the aggregate function.Extrapolation will automatically be applied, when for an interval boundary (start or end time) only values before the boundary exist.
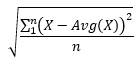
Interpolation and Extrapolation can either be set to "sloped" or "stepped":
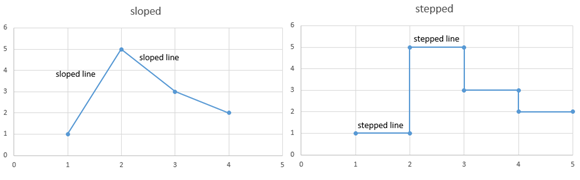
Sloped and stepped inter-/extrapolation
The supported aggregates include all aggregates according to the OPC UA specification and also the atvise specific "Sampled" aggregate:
Aggregate functions
- AnnotationCount
Returns a count of all annotations in the interval.
The timestamp of the aggregate will always be the start of the interval.
Note: Since annotations are currently not supported by the atvise server, the result will always be 0.
- Average
Adds up all values with status "Good" for each interval, and divides the sum by the number of values with status "Good". This aggregate is not time based so the "Minimum Good Values" and "Minimum Bad Values" applies to the number of values in the interval.
The timestamp of the aggregate will always be the start of the interval.
- Count
Retrieves a count of all the values within an interval. If one or more values are non-Good, they are not included. If no Good data exists for an interval, the count is zero.
The timestamp of the aggregate will always be the start of the interval.
- Delta
Retrieves the difference between the earliest and latest Good values in the interval. The aggregate is negative if the latest value is less than the earliest value.
The timestamp of the aggregate will always be the start of the interval.
- DeltaBounds
Returns the difference between the StartBound and the EndBound aggregates with the exception that both the start and end shall be Good. The aggregate is negative if the EndBound aggregate is less than the StartBound aggregate.
The timestamp of the aggregate will always be the start of the interval.
- DurationBad
Divides the interval into regions of Bad and non-Bad data. Each region starts with a value in the interval. If that value is Bad the region is Bad. The aggregate is the sum of the duration of all Bad regions expressed in milliseconds.
The status of the first region is determined by finding the first value at or before the start of the interval.
The timestamp of the aggregate will always be the start of the interval.
- DurationGood
Divides the interval into regions of Good and non-Good data. Each region starts with a value in the interval. If that value is Good the region is Good. The aggregate is the sum of the duration of all Good regions expressed in milliseconds.
The status of the first region is determined by finding the first value at or before the start of the interval.
The timestamp of the aggregate will always be the start of the interval.
- DurationInStateNonZero
Returns the time duration (in milliseconds) during the interval that the value (also applicable for Boolean) was not zero or true. The Simple Bounding Values for the interval are used to determine the initial value. If one or more values are non-Good, they are not included in the Duration.
The timestamp of the aggregate will always be the start of the interval.
- DurationInStateZero
Returns the time duration (in milliseconds) during the interval that the value (also applicable for Boolean) was zero or false. The Simple Bounding Values for the interval are used to determine the initial value. If one or more values are non-Good, they are not included in the Duration.
The timestamp of the aggregate will always be the start of the interval.
- End
Retrieves the latest value within the interval, and returns that value and status with the timestamp at which that value occurs.
- EndBound
Returns the value and status at the end time for the interval by calculating the Simple Bounding Values for the interval.
The timestamp of the aggregate will always be the start of the interval.
- Interpolative
Returns the interpolated value for the start time of each interval.
- Maximum
Retrieves the maximum Good value within the interval. If the same maximum exists at more than one timestamp, the oldest one is retrieved.
The timestamp of the aggregate will always be the start of the interval.
- Maximum2
Retrieves the maximum Good value for each interval as defined for Maximum except that Simple Bounding Values are included.
The timestamp of the aggregate will always be the start of the interval.
- MaximumActualTime
Retrieves the maximum Good value within the interval, and returns that value with the timestamp at which that value occurs. If the same maximum exists at more than one timestamp, the oldest one is retrieved.
- MaximumActualTime2
Retrieves the maximum Good value for each interval as defined for MaximumActualTime except that Simple Bounding Values are included.
The timestamp of the aggregate will always be the timestamp of the maximum Good value for every interval.
- Minimum
Retrieves the minimum Good value within the interval. If the same minimum exists at more than one timestamp, the oldest one is retrieved.
The timestamp of the aggregate will always be the start of the interval.
- Minimum2
Retrieves the minimum Good value for each interval as defined for Minimum except that Simple Bounding Values are included.
The timestamp of the aggregate will always be the start of the interval.
- MinimumActualTime
Retrieves the minimum Good value within the interval, and returns that value with the timestamp at which that value occurs. If the same minimum exists at more than one timestamp, the oldest one is retrieved.
- MinimumActualTime2
Retrieves the minimum Good value for each interval as defined for MinimumActualTime except that Simple Bounding Values are included.
The timestamp of the aggregate will always be the timestamp of the minimum Good value for every interval.
- NumberOfTransitions
Returns a count of the number of transitions the value had during the interval. If one or more values are Bad, they are not included in the count.
The timestamp of the aggregate will always be the start of the interval.
- PercentBad
Performs the following calculation:
PercentBad = DurationBad / Interval x 100, where: DurationBad is the result from the DurationBad aggregate.
The result is in the range from 0 to 100.
The timestamp of the aggregate will always be the start of the interval.
- PercentGood
Performs the following calculation:
PercentGood = DurationGood / Interval x 100, where: DurationGood is the result from the DurationGood aggregate.
The result is in the range from 0 to 100.
The timestamp of the aggregate will always be the start of the interval.
- Range
Finds the difference between the maximum and minimum Good values in the interval. If only one Good value exists in the interval, the range is zero. Note that the range is always zero or positive.
The timestamp of the aggregate will always be the start of the interval.
- Range2
Finds the difference between the maximum and minimum values in the interval as returned by the Minimum2 and Maximum2 aggregates. Note that the range is always zero or positive.
The timestamp of the aggregate will always be the start of the interval.
- Sampled
Takes a sample of the raw value in the given sampling interval. Because the raw value is directly taken from the process image, post-aggregation for sampled data is not available.
The timestamp of the aggregate will always be the start of the interval.
- StandardDeviationPopulation
Uses the formula
 , where X is each Good value in the interval, Avg(X) is the average of the Good values, and n is the number of Good values in the interval.
For every interval where n = 1, a value of 0 is returned.
This calculation is for a full population where the calculation is done on the full set of data. An example would be when the underlying data is collected on an event basis versus sampled from the data source.
Use StandardDeviationSample to calculate the standard deviation of a subset of the full population.
The timestamp of the aggregate will always be the start of the interval.
- StandardDeviationSample
Uses the formula
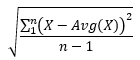 , where X is each Good value in the interval, Avg(X) is the average of the Good values, and n is the number of Good values in the interval.
For every interval where n = 1, a value of 0 is returned.
This calculation is for a sample population where the calculation is done on a subset of the full set of data. An example would be when the underlying data is sampled from the data source versus stored on an event basis.
Use StandardDeviationPopulation to calculate the standard deviation of a full set of data.
The timestamp of the aggregate will always be the start of the interval.
- Start
Retrieves the earliest value within the interval, and returns that value and status with the timestamp at which that value occurs.
- StartBound
Returns the value and status at the start time for the interval by calculating the Simple Bounding Values for the interval.
The timestamp of the aggregate will always be the start of the interval.
- TimeAverage
Starting at the starting bounding value a straight line is drawn between each value in the interval ending at the ending bounding value. The area under the lines is divided by the length of the interval to yield the average. Note that this calculation always uses a sloped line between points. TimeAverage2 uses a stepped or sloped line depending on the setting "interpolation" of the related data archive.
The timestamp of the aggregate will always be the start of the interval.
- TimeAverage2
Starting at the starting bounding value a straight line is drawn between each value in the interval ending at the ending bounding value. The area under the lines is divided by the length of the interval to yield the average. Note that this calculation uses a stepped or sloped line depending on the setting "interpolation" of the related data archive; TimeAverage always uses a sloped line between points.
The timestamp of the aggregate will always be the start of the interval.
- Total
Performs the following calculation for each interval:
Total = TimeAverage x Interval (seconds), where TimeAverage is the result from the TimeAverage aggregate.
The timestamp of the aggregate will always be the start of the interval.
- Total2
Performs the following calculation for each interval:
Total2 = TimeAverage2 x Interval of good data (seconds), where TimeAverage2 is the result from the TimeAverage2 aggregate.
The interval of good data is the sum of all sub-intervals where non-Bad data exists; e.g. if a value was Bad for 1 minute in a 5-minute interval then the interval of good data would be the 4-minute period.
The timestamp of the aggregate will always be the start of the interval.
- VariancePopulation
Retrieves the square of the standard deviation. Its behaviour is the same as the StandardDeviationPopulation aggregate.
This calculation is for a full population where the calculation is done on the full set of data.
Use VarianceSample to calculate the variance of a subset of the full population.
The timestamp of the aggregate will always be the start of the interval.
- VarianceSample
Retrieves the square of the standard deviation. Its behaviour is the same as the StandardDeviationSample aggregate.
This calculation is for a sample population where the calculation is done on a subset of the full population.
Use VariancePopulation to calculate the variance of a full set of data.
The timestamp of the aggregate will always be the start of the interval.
- WorstQuality
Returns the worst status code of the values in the interval where a Bad status is worse than Uncertain, which is worse than Good. If multiple values exist with the worst quality but different StatusCodes then the StatusCode of the first value is returned.
The timestamp of the aggregate will always be the start of the interval.
- WorstQuality2
Returns the worst status of the values in the interval as defined for WorstQuality except that Simple Bounding Values are included.
If multiple values exist with the worst quality but different StatusCodes then the StatusCode of the first value is returned.
The timestamp of the aggregate will always be the start of the interval.
Parametrization of aggregates
To get best performance when querying aggregated values, aggregates in atvise are pre-calculated and historized according to the parametrization. Therefore, when using aggregates, the first step is to parametrize one or more aggregate archives (see Add Archive Group).
Furthermore, aggregate templates need to be parametrized. An aggregate template combines one or more aggregate functions. Finally, these aggregate templates will be assigned to a dedicated node, which defines what kind of aggregates will be calculated in what intervals for this node.
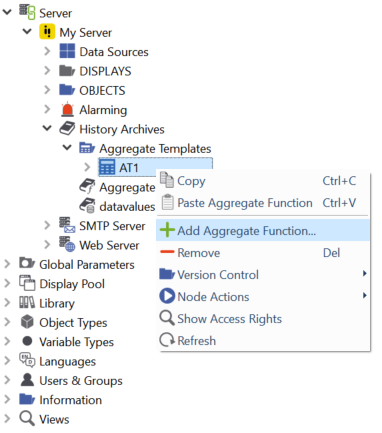
Right-click on Aggregate Templates and select to create one; e.g. "AT1":
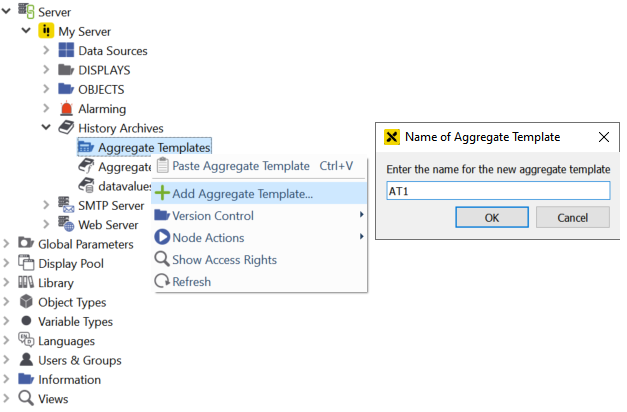
Creating an aggregate template
This aggregate template now appears in the project tree under Aggregate Templates.
Right-click on the aggregate template (e.g. "AT1") to add aggregate functions:
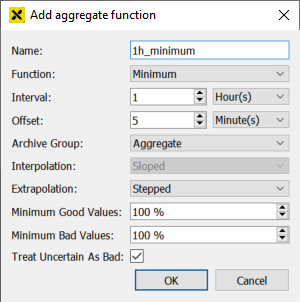
Creating an aggregate function
In the dialog "Add aggregate function" following items can be configured:
- Name
Name of the aggregate function (without special characters and without spaces).
- Function
One of the supported aggregate functions.
- Interval
Time span for calculating the aggregate. The intervals supported by atvise are:
Seconds (only for aggregate function "Sampled")
Minutes
Hours
Days
Months (starts with first day of each month)
- Offset
Offset to the given interval. In the example "1h_minimum" the minimum would be calculated every hour but shifted by 5 minutes, e.g. 02:05, 03:05, 04:05.
- Archive Group
One of the previously defined aggregate archives to store the calculated aggregate. In our example the aggregate archive "Aggregates".
Hint
If you don't select an aggregate archive, the aggregate will not be calculated at all. Therefore you cannot use it with
webMI.data.subscribeFilter()and not for chained aggregates (see below). You also cannot use it for history synchronization. It may still be used with history pass-through though.- Interpolation
Sloped or Stepped. Only for aggregate function "Sampled". Will be used by chained aggregates based on this "Sampled" aggregate function.
See Historizing data for how to set interpolation for other aggregate functions.
- Extrapolation
Extrapolation behavior.
- Minimum Good Values
At least the configured percentage of the values in the interval must have the status Good so that the status of the aggregate will also be Good (default: 100)
- Minimum Bad Values
At least the configured percentage of the values in the interval must have the status Bad so that the status of the aggregate will also be Bad (default: 100).
Both settings are related as follows:
Minimum Good Values ≥ (100 - Minimum Bad Values)
If both values are equal, the value of "Minimum Good Values" will be used.
- Treat Uncertain as Bad
If activated, values with status Uncertain will be treated as of status Bad, otherwise as of status Good (default: activated)
Hint
An aggregate template can contain more than one aggregate function. The combination of aggregate function and interval must be unique for all aggregate functions in a template. When saving an aggregate function, the whole template will be checked and an error message is shown if the check fails. The check also includes the additional requirements for chained aggregates (see below).
The same checks are also performed if you e.g. import aggregate functions from an XML file or directly change the configuration variables in the address space. In case of an error a message will be written to the atvise log file.
When you add multiple aggregate functions, we distinguish the following two scenarios:
Assignment on first level, i.e. right-click on an existing aggregate template (e.g. "AT1"). This means that the aggregate will be calculated based on the historized raw values.
Assignment (right-click) on an existing aggregate function. This means that the aggregate will be calculated based on the selected aggregate. We call this "chained aggregate". For instance, the aggregate "4h_minimum" is a chained aggregate since it is based on the aggregate "1h_minimum". Same applies to "1d_minimum".
Hint
The aggregate function "Sampled" can only be used on the first level of an aggregate template. However, at level two, other aggregate functions can be based on the aggregate function "Sampled".
Example:
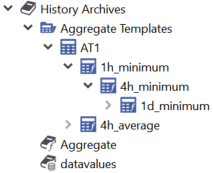
This example illustrates that the aggregates "1h_minimum" and "4h_average" are based on raw values.
In contrast, the aggregate "4h_minimum" will be calculated based on the calculated aggregate "1h_minimum". Same applies to "1d_minimum" which will be calculated based on "4h_minimum".
Notes for chained aggregates:
The interval of the chained aggregate must be an integral multiple of the subjacent aggregate.
The changed aggregate must not necessarily have the same aggregate function as the subjacent aggregate. E.g. it may be reasonable to have a daily minimum based on a 5-minute average.
Chose the offsets so that the start time of each interval of the chained aggregate coincides with the start time of an interval of the subjacent aggregate.
A reasonable choice of the intervals will positively impact the duration of the calculation and therefore the system utilization. E.g. an aggregate with a one week interval based on raw values can lead to a huge number of values needed for the calculation of the aggregate. In this case it is better to parametrize an aggregate with a one day interval based on raw values and use this as base for the aggregate with the one week interval.
Finally, a raw archive (type "data") AND an aggregate template must be assigned to a node to enable aggregates for that node (see Historizing (and aggregating) a node). Please note that only one aggregate template can be assigned to a node.
The aggregates are limited by the license in terms of the amount of used aggregates. This amount can be determined for each aggregate template as follows:
number of aggregate functions in the aggregate template x number of nodes who have assigned this aggregate template.
Hint
In case the number of aggregates according to the license is exceeded, the whole aggregation will be stopped and not only the aggregation of nodes which are beyond this limit. This is indicated by an entry in the atvise logfile.
Query of aggregates
Since the calculated aggregates are historized, they can be retrieved similar to raw values (see Query history).