6 Parameterization option 2a - object oriented
In this section we will start with object-oriented engineering. We will create a dynamic object display for the light objects (L001, L002) in our object structure using a display parameter for every required data variable. But first, we will add a background display.
Hint
Use this type of parameterization to create an object display for single data variables or for multiple data variables that belong to an object type logically but do not have a clear object structure.
6.1 Adding a new background display
In the first step we will add a background display to the main menu.
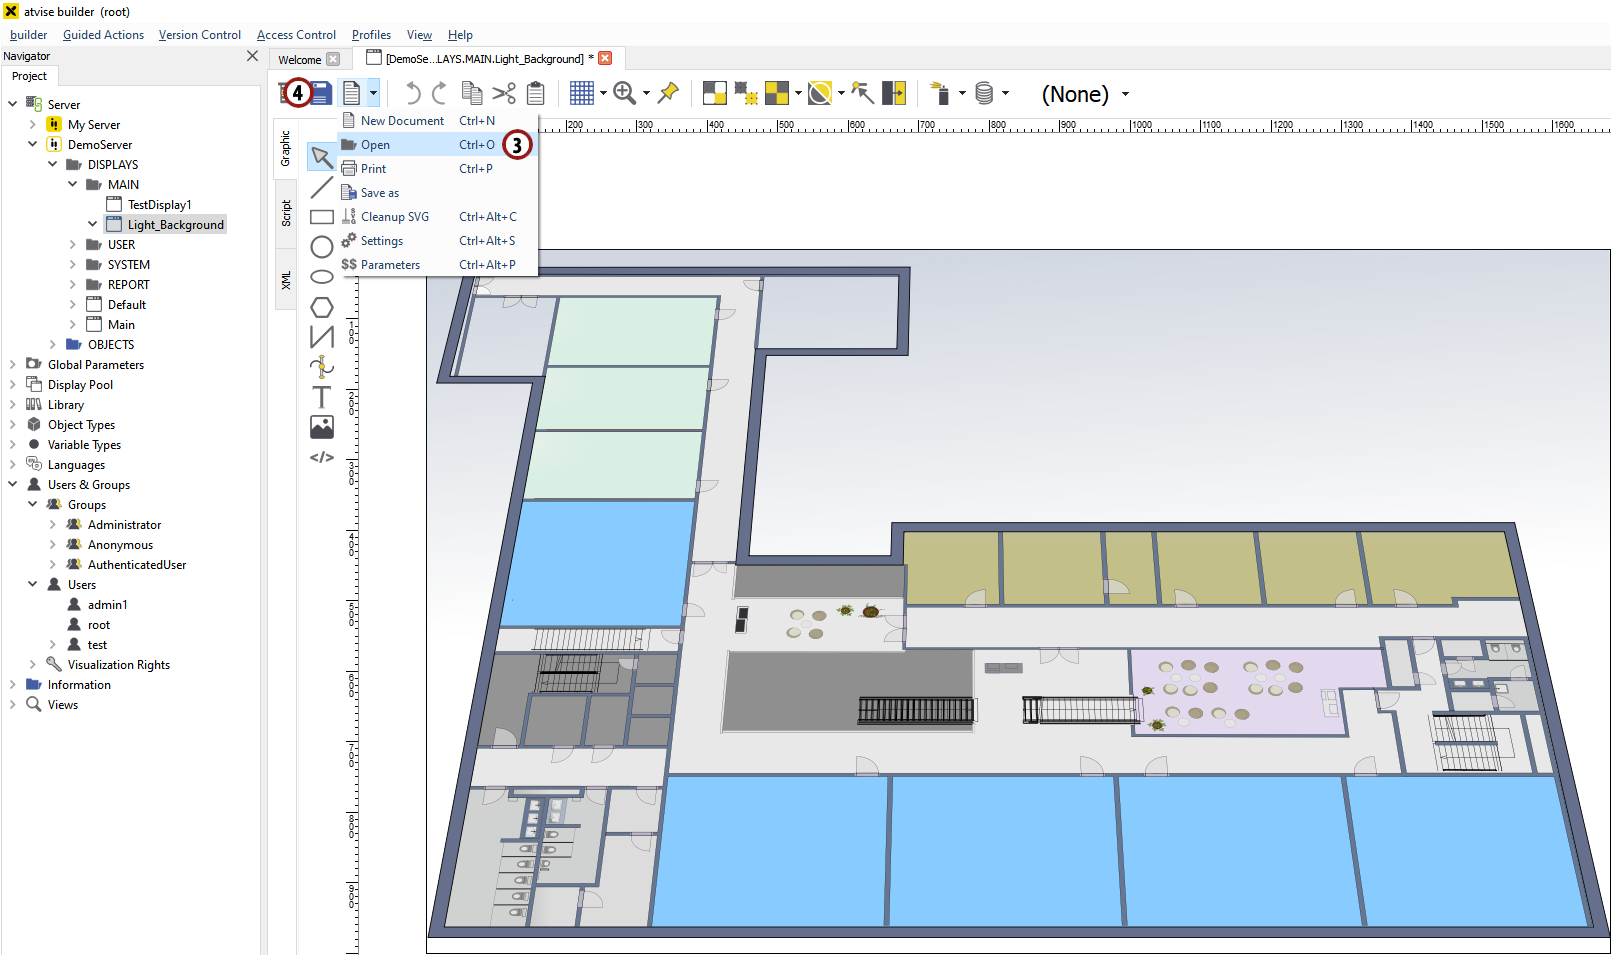
Create a new display "Light_Background" by right-clicking on the DemoServer ‣ Displays ‣ MAIN folder and choosing "Add Display".
Double-click on the "Light_Background" entry to open it.
Click on (
 ) in the symbol bar and in "[atvise directory]/library/displays", choose the file named "office_light_bg.svg". This file shows a floor plan of an office and will act as the background image.
Save the display.
Adding a background display
6.2 Adding a new object display
In the following sections we will create our own display object which will be used to set and display the value of data variables.
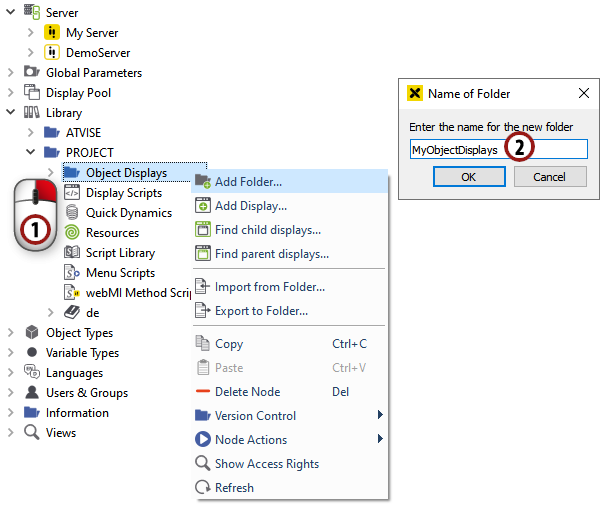
Right-click on Library ‣ PROJECT ‣ Object Displays and choose "Add Folder…".
Name the folder "MyObjectDisplays" and add it by clicking OK.
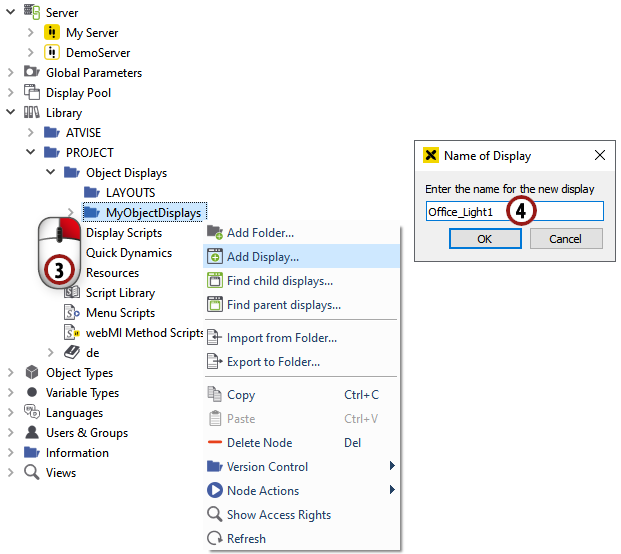
Right-click on the new "MyObjectDisplays" folder and choose "Add Display".
Type in "Office_Light1" as name for the display and add it to the project by clicking OK.
Add "MyObjectDisplays" folder
Add a new display to the folder
6.3 Designing an object display
6.3.1 Creating a background
Double-click on the "Office_Light1" node to open the graphics editor.
First, we draw the background of our object display. Draw a rectangle of the desired size - it is possible to change its size afterwards.
For our background we want to have a gradient fill, so make sure the rectangle is marked and click on the "fill" option just below the drawing area. In the window which appears, click on the
 symbol symbol to choose a gradient fill.
You can change the colors of the gradient by double-clicking on the small triangles under the gradient bar.
Change the angle of the gradient by moving the red circles in the preview box. Define a matching gradient.
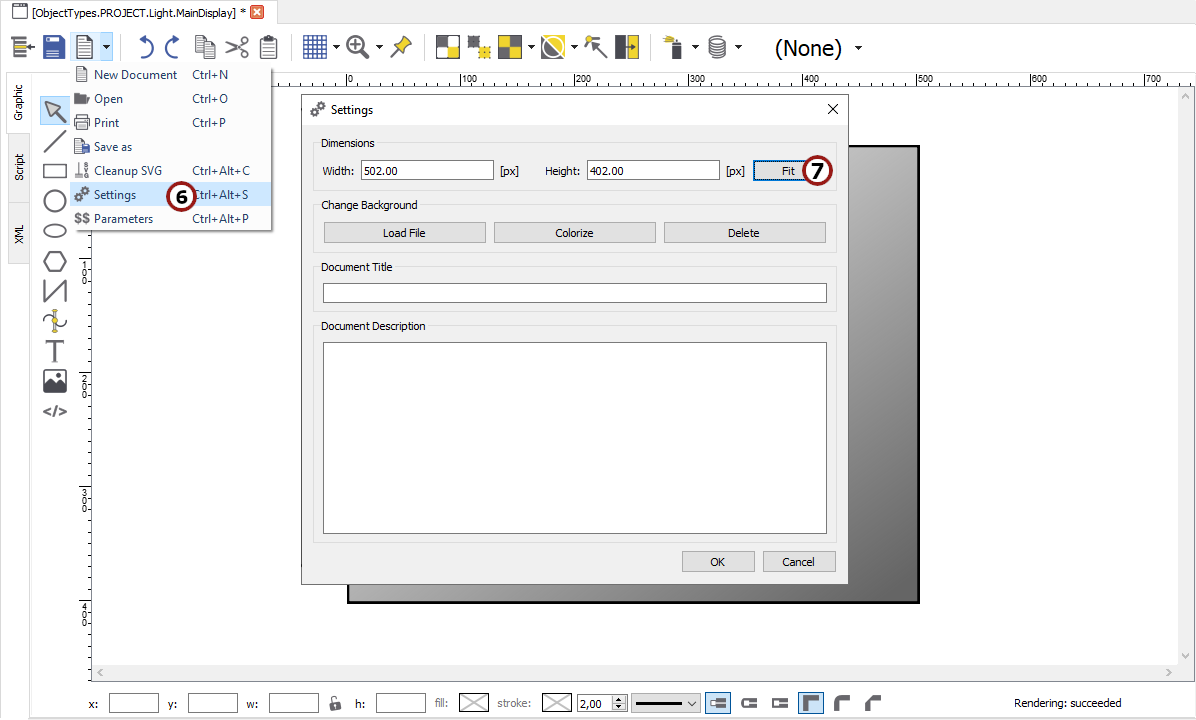
When you have finished the background design, click on (
 ) in the top symbol bar.
Click on the Fit button in the dialog which appears to adjust the page size to the size of the background rectangle.
Creating a background for "Office_Light1"
6.3.2 Drawing a bulb
We want to display our "LightIntensity" data variable through the color of a light bulb.
Draw a small rectangle in the middle left side of the object display. Use the rectangle drawing tool as described in section 3.2.
Draw a circle on top of the rectangle to make it look like a bulb. Use the circle drawing tool as described in section 3.2.
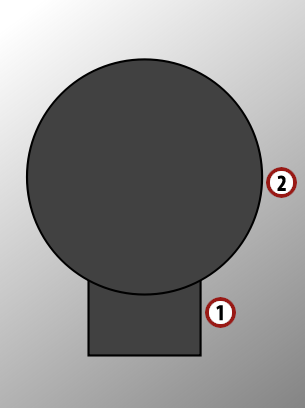
Try to draw a form that looks like a bulb
6.3.3 Drawing a red border to display a malfunction
A red border is intended to signalize an internal malfunction.
Draw a rectangle around the object display.
Select "None" in the "Fill" tab.
Choose a bigger line width and a red color in the "Stroke" tab.
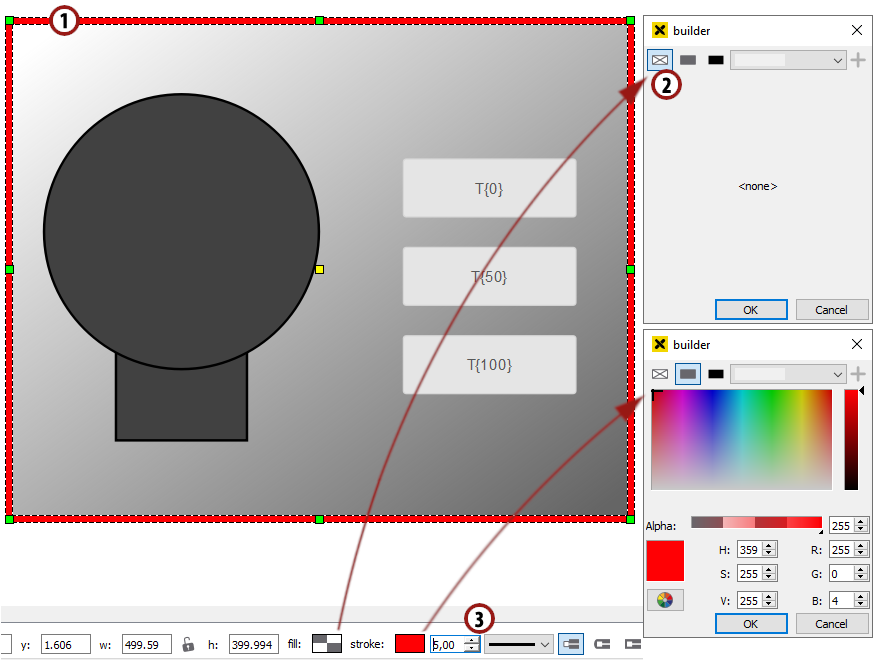
Draw a red border around the object
6.3.4 Creating display parameters
In this step we will define parameters for every data variable we want to use in this display.
Choose from the symbol bar.
Type in the names of the two data variables of the light object. For our example, let us choose "LightIntensity" and "InternalMalfunction".
Type in a description for the two parameters.
Select "mandatory" in the "Behavior" column for both parameters.
Apply the "Edit Parameters" dialog by clicking OK
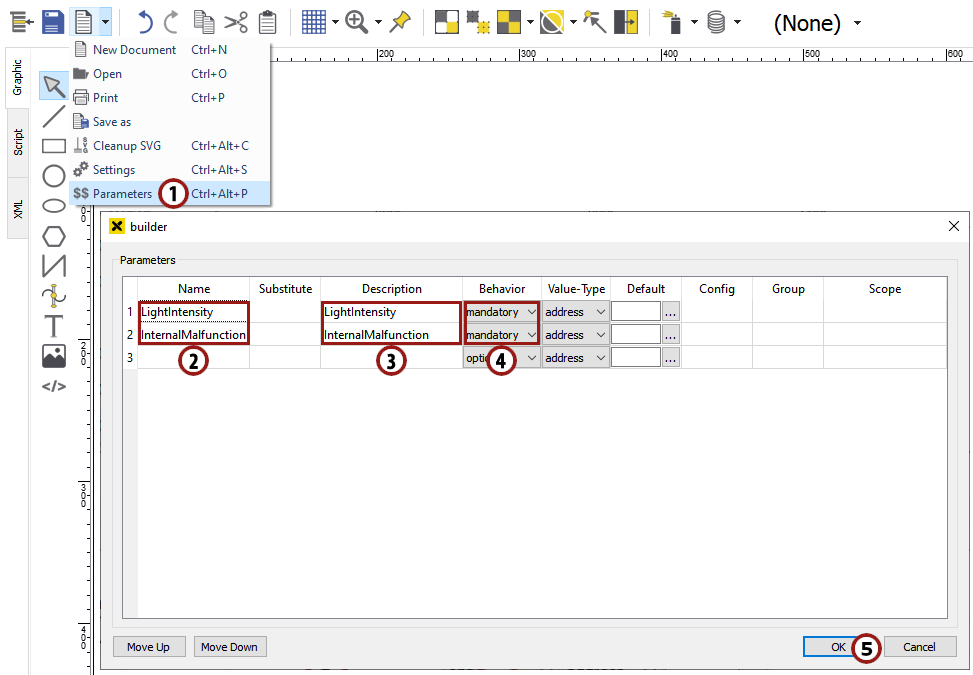
Adding parameters to the display
6.4 Adding dynamization
In this section we want to use predefined controls and simple dynamics to add dynamization to our object display.
6.4.1 Adding and parameterizing three buttons
We want to set the value of LightIntensity, so we are going to add three buttons for 0 %, 50 % and 100 % light intensity to our display.
In the bottom area of the graphics editor you can see a selection of predefined controls. Drag & drop the "Button Set Address" control into your drawing area.
On the right side, you can see a list of all parameters of the referenced control. Set the text of the button by entering "0" in the "label" field.
To set its "base" parameter, click the
 button to activate relative addressing.
Use the drop-down list to choose "LightIntensity".
Set the "value" parameter by entering "0". This value will be set to the base address when clicking the button.
Add a button with the label "50" and value "50" the same way.
Add a button with the label "100" and value "100" the same way.
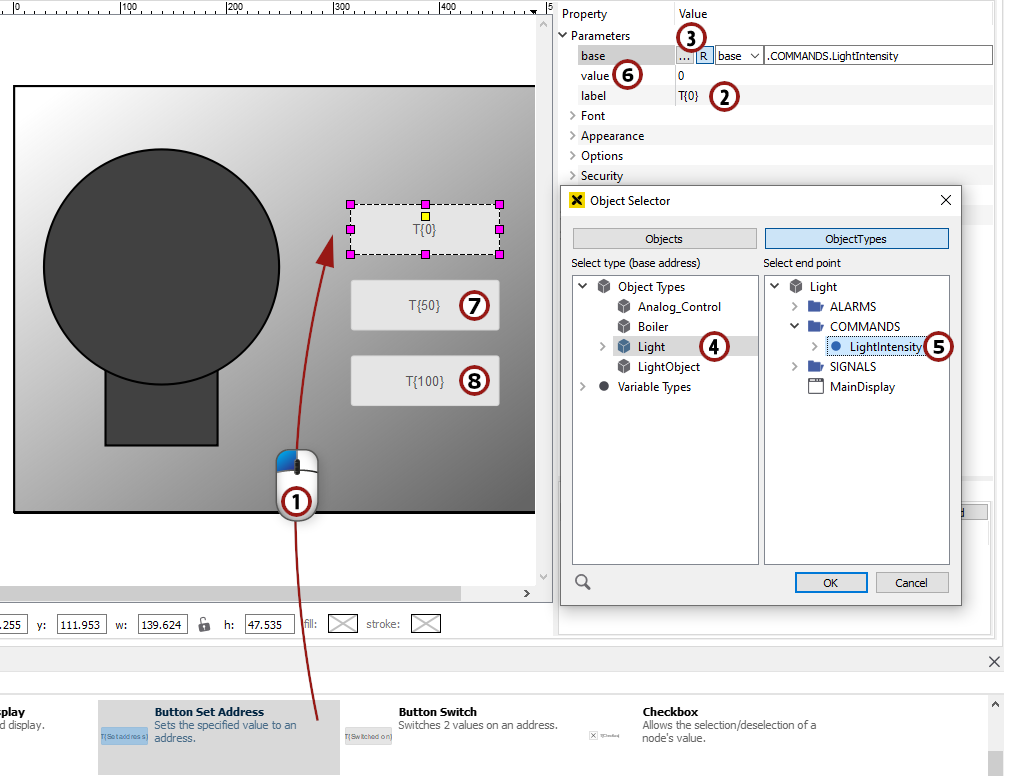
Adding and parameterizing three buttons to set "LightIntensity"
6.4.2 Color change of the light bulb to display the light intensity
In this section, we want to add a simple dynamic to our bulb to display the light intensity.
Click on the circle of the bulb to mark it and open the "Simple Dynamics" dialog as described in section 5.3.1
Hint
If you have worked through section 5.3, you are already familiar with this dialog. The only new thing is that we want to address our data variable relatively.
Choose
 from the possibilities on the left.
Click on the
button to activate relative addressing.Use the drop-down list to choose "LightIntensity".
Choose "Number" as the value type.
We want to change the color of the circle, so we choose
 on the left in the ACTION section.
The range of our "LightIntensity" variable is from 0 - 100, so we choose "Value Range" as the type and enter the minimum and maximum values.
We want to display the circle in a color range from gray to yellow, so we check the fill box and choose a gray color as the start fill and a yellow color as the stop fill by clicking on
 .
.Hint
If the value of the data variable is 0, the start fill will be displayed, if it is 100, the stop fill will be displayed. Values in between are merged according to the gradient from the start fill to the stop fill.
We are now finished with the dynamization. Apply the dialog by clicking OK.
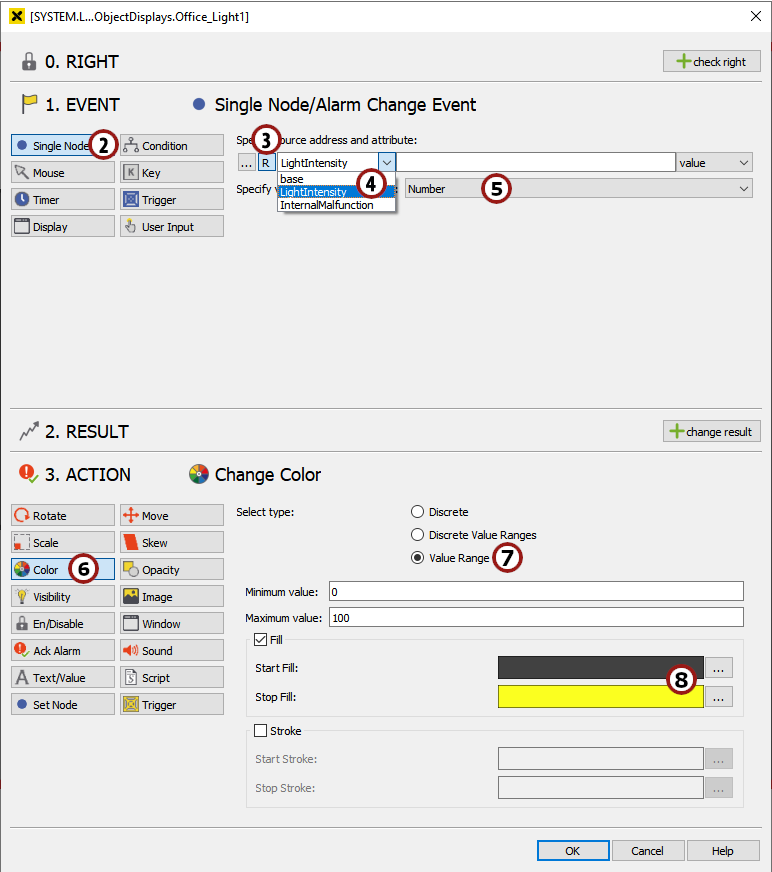
"Simple Dynamics" dialog for the circle of our light bulb
6.4.3 The visibility of the malfunction border
In this step, we want to change the visibility of our red border in dependence on the value of the "InternalMalfunction" parameter.
If the value is true, we want the border to be visible, if the value is false, we want the border to be invisible.
Mark the red border you drew in step 6.3.3 and start the "Simple Dynamics" dialog.
Choose
from the possibilities on the left.We want to write a relative parameter, so click the
button.Use the drop down list to choose "InternalMalfunction".
Choose "Boolean" as the value type.
We want to change the visibility of the border, so choose
 in the ACTION part.
If the value is true, we want the border to be visible, so choose "visible" for this condition.
Add a second condition by clicking on
 , changing the value column to "false" and choosing "invisible".
Apply the "Simple Dynamics" dialog by clicking OK.
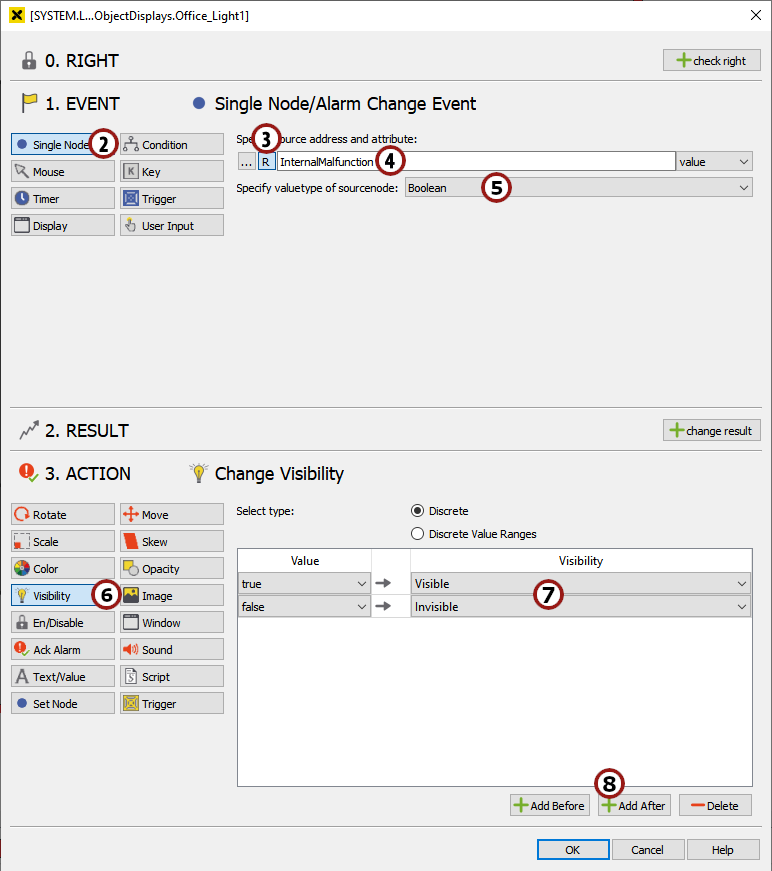
Changing the visibility of the border in dependence on a boolean value
Now we have finished the engineering of our object display.
6.5 Adding objects to a main display
Open the "Light_Background" display from the MAIN folder.
Drag & drop the "Office_Light1" object display into the "Light_Background" display.
Make sure the "Office_Light1" object is marked. On the right of the atvise builder interface, you will see a list of all its parameters.
Select the "L001.LightIntensity" variable as the address for the light intensity parameter and the "L001.InternalMalfunction" as the address for the internal malfunction parameter using the
selector.Drag & drop the Objects ‣ L001 ‣ InternalMalfunction variable into the "Light_Background" display. A small button will appear which can be used to set the variable in the visualization.
Repeat steps 2 to 5, but now choose "L002.LightIntensity" and "L002.InternalMalfunction" as parameters and drag & drop Objects ‣ L002 ‣ InternalMalfunction into the "Light_Background".
Position the 2 displays in 2 different rooms of the office plan.
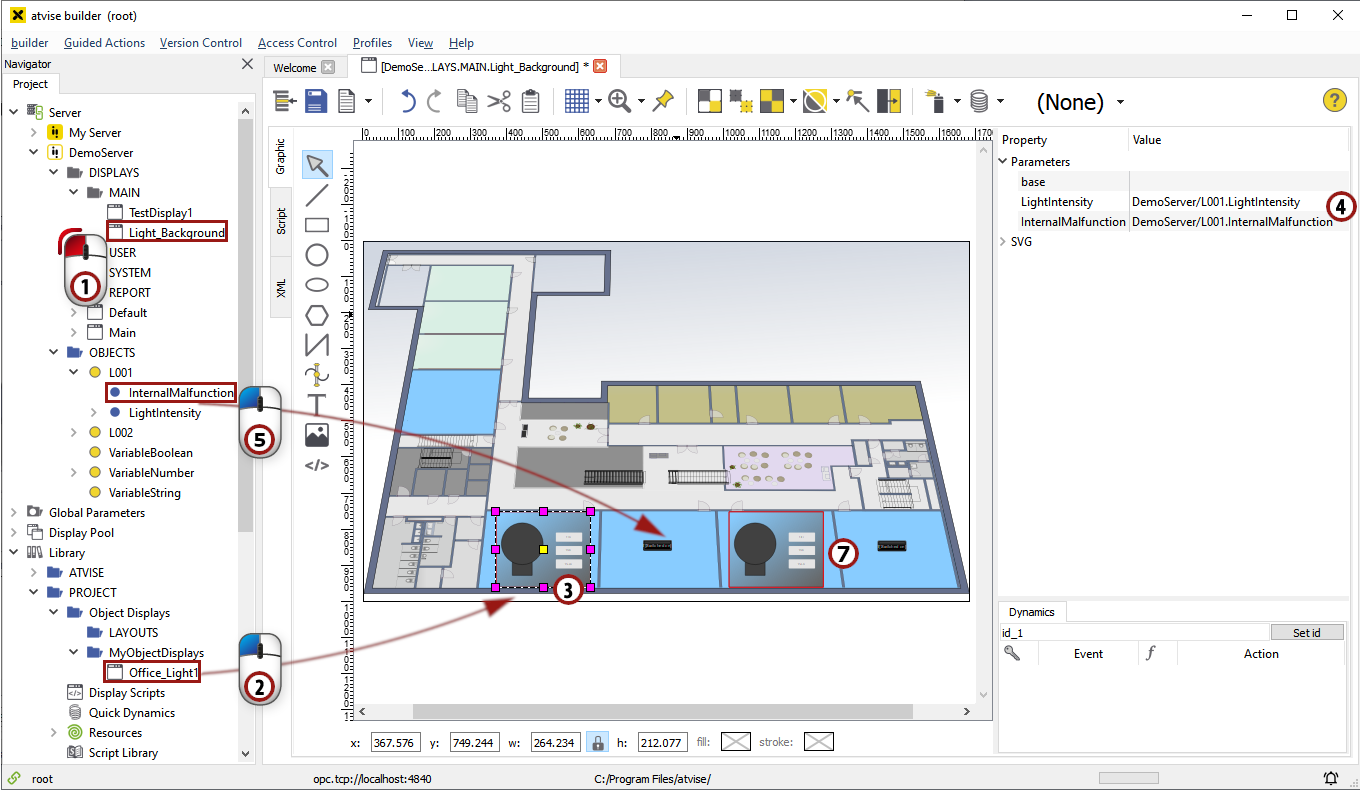
Drag & Drop the "Office_Light1" display into the "Light_Background" display and set the parameters
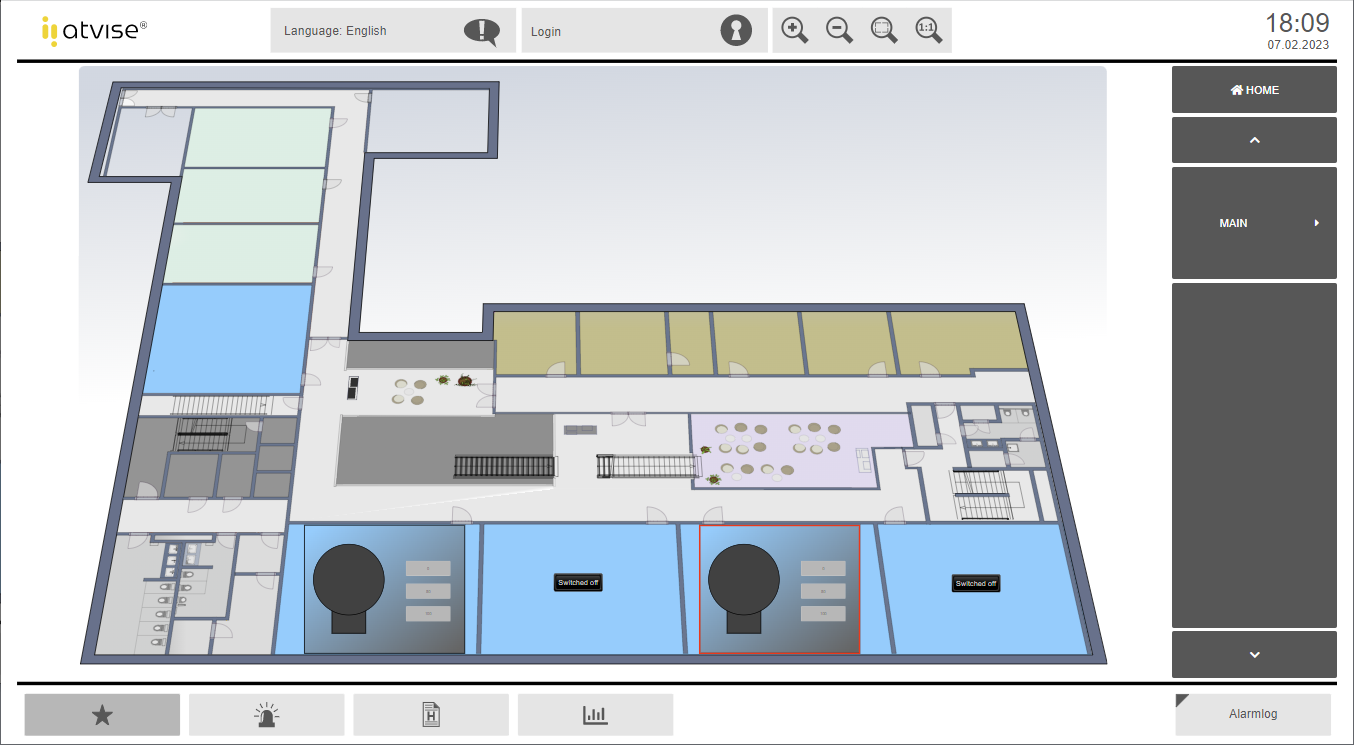
6.6 Generating and viewing the visualization
Save the display by clicking  and generate the visualization by choosing from the menu bar. Then start a web browser (as described in section 4) and view the "Light_Background" display in the visualization. Set the value of the light intensity of one of the objects using the three buttons and see how the color of the bulb changes. Also use the InternalMalfunction buttons to make the red border appear and disappear.