Template
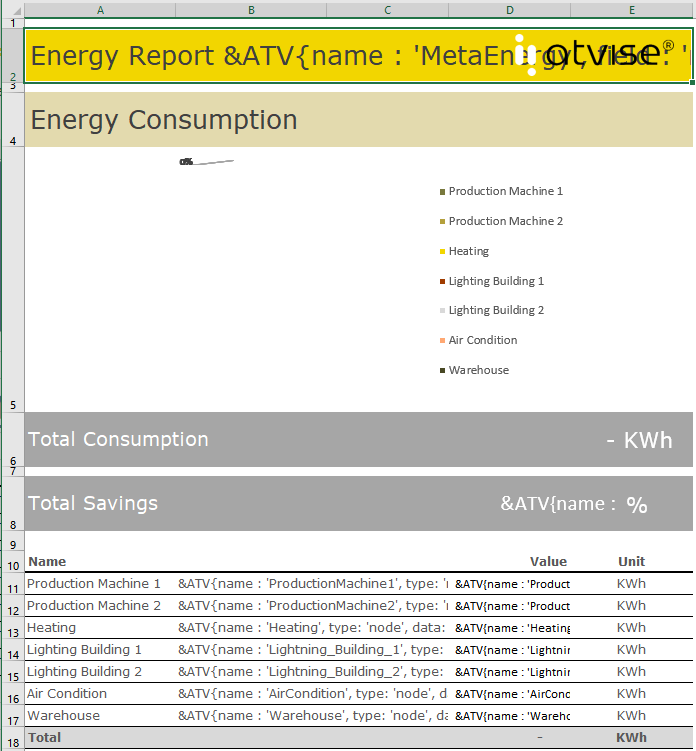
A template is an Excel file that is the basis for the generated report. It defines the layout of the report and specifies the data that shall be queried and further processed by using Excel functions and formulas. The template's design and layout (e.g. page orientation) are applied when creating or converting a report. Thus, it is possible to create reports with individual corporate designs, charts, etc.
Markup Language
The data that shall be queried from atvise must be defined via markup language. It is possible to query current process values, historical data, alarms and custom metadata.
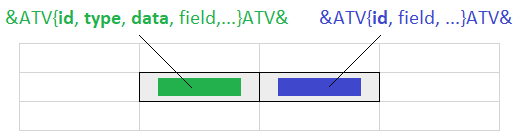
JavaScript Object Literals are used to define the template's markups. They must be embedded into &ATV{ … }ATV& tags:
&ATV{id: '<MarkupID>', type: 'node|alarm|query|meta', data: '<DataDefinition>', field: '<DataFieldName>', sortfield: '<FieldName>', sortorder: 'asc|desc', formula: '<ExcelFormula>', count: <Number>, fill: '<FillPattern>', fieldtype: 'localtime|utctime', optional: true|false, translate: true|false}ATV&
Each query must be assigned to a unique markup ID (id). Moreover, it is necessary to define how the specific data shall be queried. Therefore, type and data must be specified in exactly one cell for each query. type defines the query type (node, query, alarm, meta), data defines which specific nodes, alarms or meta data shall be queried. Depending on the selected type, a dataset with different fields is returned. Markups with the same ID can be used to access any field of the returned dataset in other cells. E.g. it is possible to display the returned value in one cell and the corresponding timestamp in another cell.
The report is created based on the template and all markups are replaced by the queried values. Markups are processed starting from the last cell of the last worksheet to the first cell of the first worksheet. If a markup with id, field and/or formula is found, the corresponding markup that contains the actual query (i.e. the same id as well as a defined type parameter) is retrieved and executed. All markups in all worksheets with the same id are replaced by the respective values. After that, the next markup with id, field and/or formula is processed. This is repeated until all markups are replaced.
Hint
Please note that the recommended maximum number of markups per template is 150. In addition, a template should not contain more than 10 worksheets and the generated report should be limited to 10 pages (A4 size).
Cell formatting
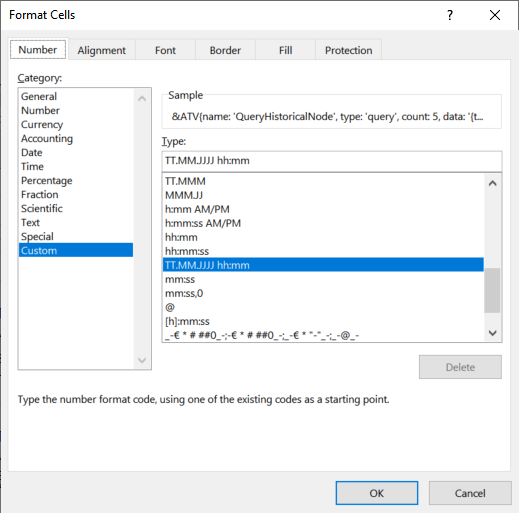
The cells in the template must be formatted in accordance with the selected field to display queried data properly. E.g. Format Cells > Custom > DD.MM.YYYY hh:mm if a timestamp shall be displayed in the created report.
Parameters
&ATV / ATV& – Keywords that mark the start and the end of the markup in one cell. Only this markup (&ATV{…}ATV&) is replaced by the corresponding value when generating a report. Any other cell content before or after the keywords remains unchanged.
id – Name of the markup ID that contains the query result. This markup ID must be specified once for every query. Can be used in other cells to access another field of this dataset.
type (Optional) – The type of the data that shall be queried. This parameter must exist exactly once in a template for every markup ID (id). Possible types:
node – Queries the value of a single node. atvise returns the result of Ua.findNode().result.
alarm – Queries alarms. atvise returns the result of alarming.list or alarming.read(conditionId)[0].
query – Queries historical values. atvise returns the result of history.query.result.
meta – A custom JavaScript object created via script. For example, can be used to query data from external databases.
Hint
atvise must not return more than 750 elements per query. Therefore, mind the time range and the expected amount of data when defining a query.
data (Optional) – Defines which data shall be queried, depending on the selected type. May not be used in a markup without type. If type=node|query, this parameter must exist exactly once for every markup ID (id) in the template. See examples below for further information.
node name (String) – Name of the node if type = node. E.g.: data: 'AGENT.OBJECTS.Node1'
ConditionId (String) – ConditionId for alarming.read() if type = alarm. If there is no ConditionId (or an empty string is specified), alarming.list is called. E.g.: data: 'AGENT.OBJECTS.Node1.Alarm.active'
query (JSON) – atvise-compliant query if type = query. Refer to filter object for further details. Possible formats for defining the query:
data:'type: ["v:1"], timestamp: ["n:>={reporttime-1m}<{reporttime}"], address: ["g:*"]'data:'{type: ["v:1"], timestamp: ["n:>= {reporttime-1m}<{reporttime}"], address: ["g:*"]}'
The wildcard {} can be used for "n:" to further define time periods. reporttime represents the current time at which the report is created (see Generating reports - report configuration - schedule or Report functions - Creating a report object). The keywords +, -, Y (year), M (month), D (day), h (hour) and m (minute) can be used to adjust the time.
meta (String/JSON) – Freely definable tag for metadata if type = meta. This value is passed to the meta script and can be used in the script to further specify data. A script parameter with the name data must be defined for the meta script. See also example below.
field (Optional, default: '') – Defines which field of the JSON string returned by atvise shall be retrieved. Nested objects can be specified via dot notation (e.g. result.values.value). Array elements can be accessed via bracket notation, e.g. field: 'value[1]'.
The names of the returned fields depend on the selected type:
node – All valid properties of the respective node.
alarm – All valid properties of an alarm object.
query – All valid properties of a filter object.
meta – Any valid name of the custom JavaScript object.
If field is not defined, all other parameters are still applied by analogy. E.g. a formula is pasted depending on the number of received elements (or number of elements defined via count).
sortfield (Optional, default: '') – The returned data is sorted by this field. Can only be defined for type=alarm|query|meta.
sortorder(Optional, default: 'asc') – Defines the sort order - ascending ('asc') or descending ('desc'). Can only be defined in conjunction with sortfield.
Hint
If sortfield is defined, values are removed (count) or added (fill) after sorting all returned values.
sortfield and sortorder only apply to the corresponding markup. E.g. if all columns of a table shall be sorted by one specific field/column, sortfield and sortorder must be specified in the same way for each markup in every column. Otherwise not all columns will be sorted and the data will be messed up.
formula (Optional, default: '') – Allows to define a valid Excel formula. The wildcard {} can be used and is replaced by the current value of field. If no value exists, it is replaced by the value of fill (or an empty string, if fill is not defined). In case of an array, the formula is automatically applied to values in the subsequent cells according to Excel's rules for copying formulas (e.g. B3, $B3, B$3, $B$3).
Using references in formulas: Relative references in formulas are only possible to cells within the respective table. References to cells outside of the table must be absolute (i.e. defined via "$"). If cells outside of the table are not referenced absolutely, the formula is replaced by the value of fill (or an empty string, if fill is not defined).
If a cell contains only &ATV{…}ATV& and the markup contains a formula, the result is automatically preceded with "=". This is not possible if a cell contains any other value besides the markup. See also example Using formulas below.
Hint
Refer to aspose.com for a list of supported functions.
Formulas must be defined in English, however, Microsoft Excel provides a plugin for translating formulas.
count (Optional, default: 0=All) – The maximum number of returned elements that are added to the report, starting with this cell. Each value is written to a new row. Any additional element is ignored. count only applies to the corresponding markup. E.g. if every column of a table shall display the same number of values, count must be defined for every markup in the table.
fill (Optional, default: '') – The value defined here is used if the query does not return as many elements as stated by count. Can only be used in conjunction with count. If there are no values in the given time range, i.e. atvise returns no data, the markup in the cell (or all cells defined via count) is replaced by the value of fill. If fill is not defined, an empty string is inserted into the respective cell(s).
Hint
The decimal point must be used as decimal mark for values. Other formats may cause problems when converting or displaying data.
fieldtype (Optional) – Can only be used in conjunction with field. Allows to define type information for the respective field. Currently it can be used to convert returned timestamps from atvise (e.g. field: 'timestamp' or field: 'activetime') into a valid Excel Date/Time format. Possible values:
localtime – Date/Time is converted to the local time of the atvise server.
utctime – Date/Time is converted to Coordinated Universal Time (UTC).
optional (Optional, default: false) – If the given field is missing in the returned data, an error is displayed in the respective cell. If optional = true is set, the value of fill (or an empty string if fill is not defined) is written to the cell instead. Can be used e.g. for alarms that return different fields (e.g. the field "ShelvingState" only exists for alarms that have been shelved).
Example:
type: 'alarm', field: 'ShelvingState', optional: true, fill: 'NotShelved'
translate (Optional, default: false) – If translate is set to true, it is checked if the returned value of the given field is a multi-language string, e.g. in case of field:'eventtext'. In this case, only the string for the defined language is displayed (see report editor - language or report functions - language parameter). Normal strings can be used as well and are displayed as usual.
If translate is set to false and a multi-language string is returned, the entire string (i.e. all languages) is displayed in the respective cell.
Error handling
If an error occurs when querying data, #ERROR <Number># with a corresponding error text is written to the cell. E.g.:
#ERROR 507# - (Found more than one markup with the same name and multiple data and/or type properties.)
#ERROR 509# - (Markup is missing either or both data and/or type properties.)
#ERROR 548# - (Cannot use optional property count without a field property)
Examples
The following examples show how queries for each type (node, query, alarm, meta) can be defined in a template. It is necessary to use a report configuration or a custom script to generate a report.
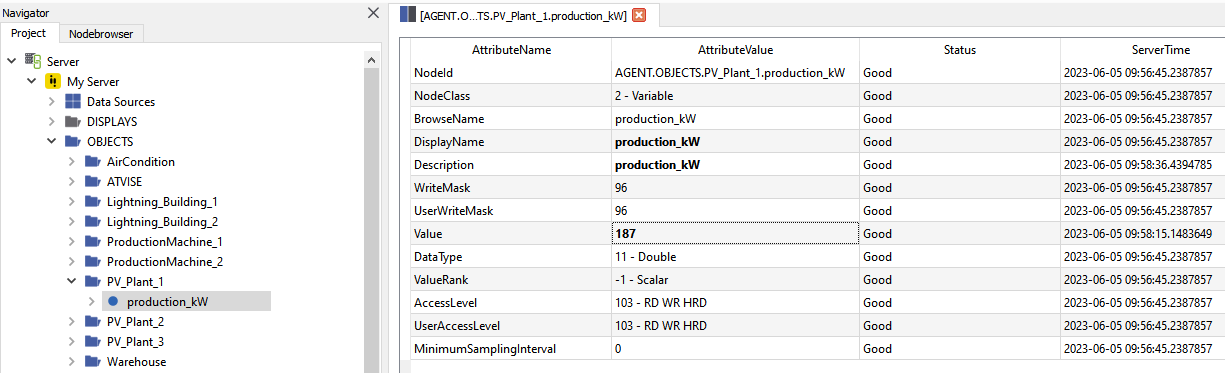
Type = node
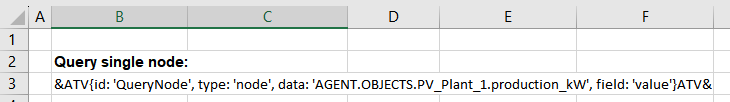
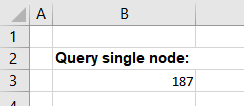
The query for the current value of node "AGENT.OBJECTS.PV_Plant_1.production_kW" is defined in cell B3. The created report shall display the node value (field: 'value') in this cell.
&ATV{id: 'QueryNode', type: 'node', data: 'AGENT.OBJECTS.PV_Plant_1.production_kW', field: 'value'}ATV&
Template:
Report:
Type = query
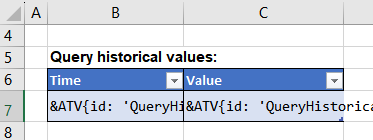
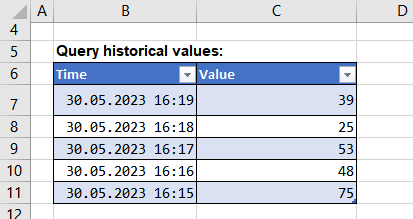
The query for historical values of node "AGENT.OBJECTS.PV_Plant_1.production_kW" is defined in cell B7. The created report shall display the timestamps (field:'timestamp') in column B and the corresponding values in column C (field:'value'). The format of cell B7 (Format cells > custom > TT.MM.JJJJ hh:mm) is automatically applied to the cells appended below.
&ATV{id: 'QueryHistoricalNode', type: 'query', count: 5, sortfield: 'timestamp', data: '{type:["v:1"],timestamp:["n:>= {reporttime-16d}"],address:["v:AGENT.OBJECTS.PV_Plant_1.production_kW"]}', field: 'timestamp', fieldtype: 'localtime'}ATV&

&ATV{id: 'QueryHistoricalNode', field: 'value', count: 5, sortfield: 'timestamp'}ATV&
Template:
Report:
Type = alarm
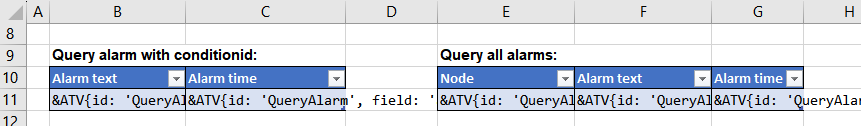
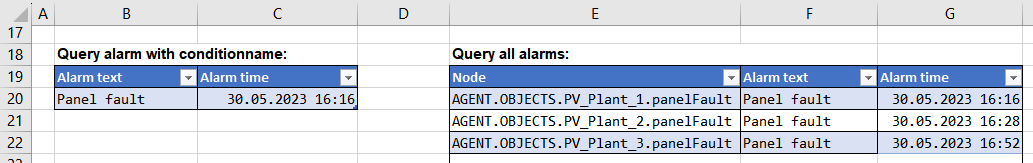
The query for alarms of node "AGENT.OBJECTS.PV_Plant_1.panelFault.Alarm.active" is defined in cell B11. The created report shall display the alarm text in English (field: 'eventtext', translate: true) in column B and the corresponding time in column C (field: 'activetime'). The language for the alarm text must be defined when creating the report (see report editor - language or report functions - language parameter).
&ATV{id: 'QueryAlarm', type: 'alarm', data: 'AGENT.OBJECTS.PV_Plant_1.panelFault.Alarm.active', field: 'eventtext', translate: true}ATV&

&ATV{id: 'QueryAlarm', field: 'activetime', fieldtype: 'localtime'}ATV&
The table on the right shall display all alarms. In this case, no conditionId is defined in the respective markup, i.e. all alarms must be queried via alarming.list(). The created report shall display the address of the respective alarm configuration in column E (field: 'base'), the alarm text in column F (field: 'eventtext', translate: true) and the corresponding time in column G (field: 'activetime').
&ATV{id: 'QueryAlarm2', type: 'alarm', field: 'base'}ATV&

&ATV{id: 'QueryAlarm2', field: 'eventtext', translate: true}ATV&

&ATV{id: 'QueryAlarm2', field: 'activetime', fieldtype: 'localtime'}ATV&
Template:
Report:
Type = meta
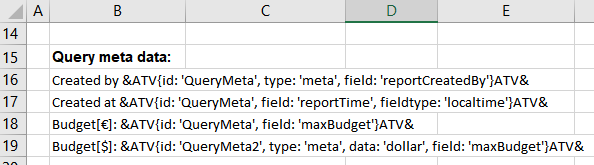
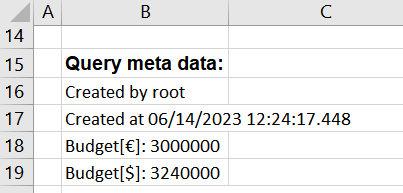
The query is defined in B16 and shall return the user that generated the report. The report time shall be displayed in cell B17. The output in B18 and B19 depends on the passed data parameter. The meta script "AGENT.OBJECTS.myCustomScript" returns an object with the properties that can be accessed via field.
Created by &ATV{id: 'QueryMeta', type: 'meta', field: 'reportCreatedBy'}ATV&

Created at &ATV{id: 'QueryMeta', field: 'reportTime', fieldtype: 'localtime'}ATV&

Budget (Euro): &ATV{id: 'QueryMeta', field: 'maxBudget'}ATV&

Budget (Dollar): &ATV{id: 'QueryMeta2', type: 'meta', data: 'dollar', field: 'maxBudget'}ATV&
Template:
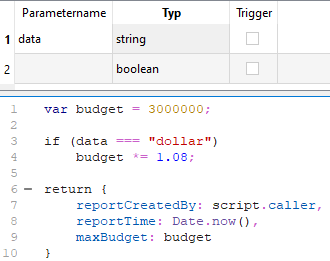
Meta script "AGENT.OBJECTS.myCustomScript" (can be defined via report configuration or report function):
Report:
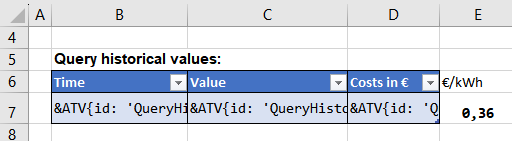
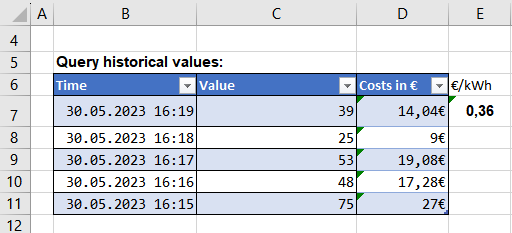
Using formulas
The formula in cell D7 of the table defines that each returned value shall be multiplied with the content of cell E7. In addition, "€" shall be added as unit.
&ATV{id: 'QueryHistoricalNode', field:'value', count:5, formula: '{} *$E$7 & "€" '}ATV&
Template:
Report:
Behavior when inserting data
Generally, the behavior of atvise report when inserting data is analog to Excel. Therefore, you have to consider Excel's copy & paste behavior when designing the report template. Otherwise the data from atvise may not be inserted correctly or the formatting of the generated report may not be as defined. Consider the following when creating your template:
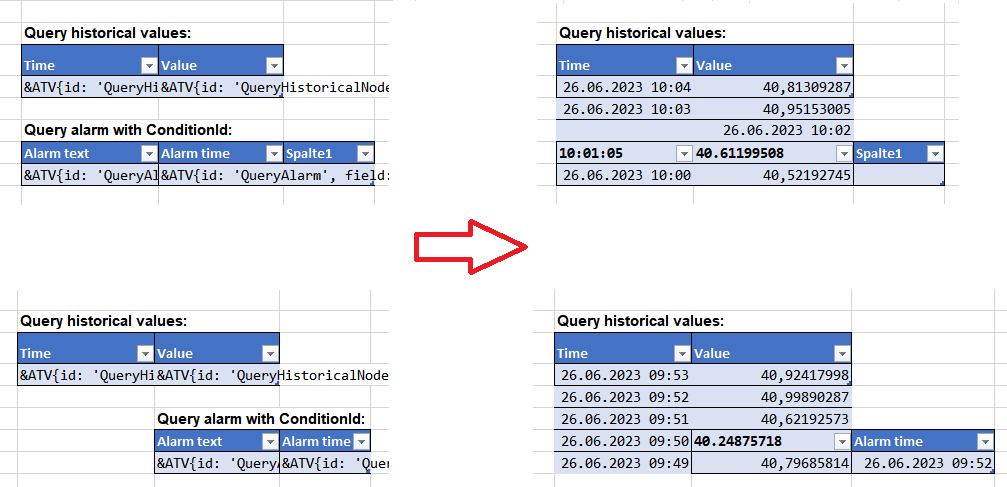
Markups in tables – If the number of returned elements exceeds the number of defined table rows, the table will be extended automatically. A new row is appended for every additional value. The format of the table is applied to the new rows. If there is another table below, it is automatically moved down. Empty lines between the tables will be overwritten (can be avoided by inserting a blank space into the required cell).
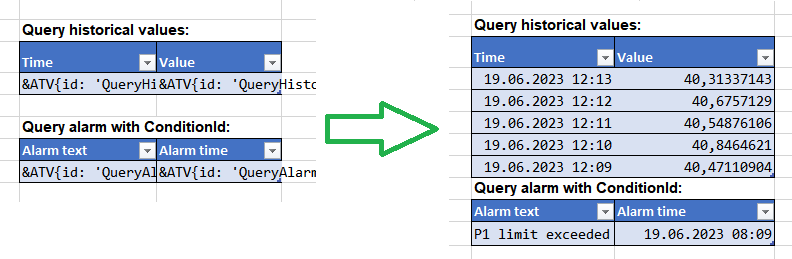
However, this automatism is only possible if the columns of the table below are not overlapping any column of the table above. If there are overlapping columns, the table below cannot be moved and its content will be overwritten:
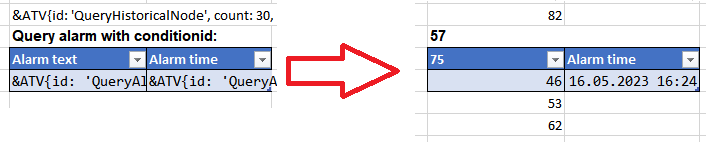
Markups in normal cells – If a query returns several values, the content of cells below the markup will be overwritten. If a table is below the markup, the table remains, however, its content will be overwritten by the returned values.
Page breaks will not be moved – If you insert a page break after a table in the template, it is not moved down when the table is automatically extended in the generated report. I.e. the table will be broken across two pages.
Placement of charts – If a chart placed below a table shall be automatically moved when the table is extended, the following rules apply:
The chart must not be wider than the table. If it overlaps the table on any side, it will be placed on top of the table in the generated report.
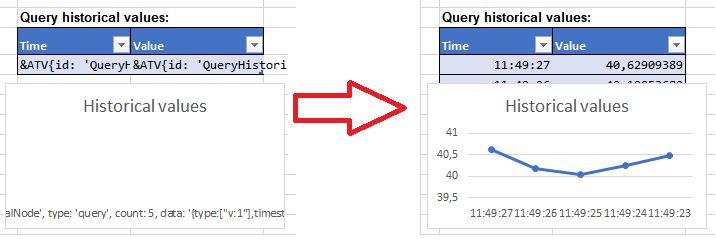
Any character (e.g. a blank space) must be entered in the row below the table to automatically move the chart.
