Integrating Scope 3 into atvise
General
Scope 3 is a real-time software oscilloscope for the Bachmann M1 controller. The atvise visualization allows to display data of this oscilloscope. This chapter describes how to integrate already recorded Scope 3 data into the visualization.
Hint
Refer to the "User Manual M-Base" for a detailed description of sampling data on an M1 controller. This manual is part of the help of the Bachmann engineering tool SolutionCenter.
Scope 3 configuration on M1 controller
Installation of necessary controller modules
In order to display recorded Scope 3 data in the visualization, the software modules Scope 3 and M1 webMI pro must be installed on the M1 controller (see chapters "Software modules > Scope 3" resp. "Software modules > M1 webMI pro" of "User manual M-Base").
The Scope 3 software module is used to collect real-time data, the M1 webMI pro software module provides the real-time data for the visualization.
Hint
For this purpose, a runtime license is required for both software modules.
Creating a recording
Creating a Scope 3 recorder and sampling real-time data on a Bachmann M1 controller is described in the help of the Bachmann SolutionCenter.
The following Scope 3 configuration serves as an example for the further description. The configuration generates real-time data on an M1 controller and provides the data for the visualization.

Highcharts configuration with Scope 3 as data source
This chapter describes how Scope 3 can be integrated into highcharts object displays as data source. The following displays are available:
Highcharts Chart Container: The highcharts display is configured in the atvise builder and cannot be changed in the visualization. The selection of displayed signals, displayed time interval, etc. can only be changed in the atvise builder.
Highcharts Main Display: The highcharts display is created in the atvise builder and configured in the visualization afterwards.
Hint
The menu can be hidden or disabled by using the respective display parameters and setting appropriate rights (see Chart container - parameter "export menu" and "necessary right for export" or Main display - parameter group "Security: export menu". This may be necessary e.g. if a browser does not support or allow file downloads.
Using the highcharts Chart Container
This section describes how to add a Chart Container to a new display, configure the highchart and display it in the visualization.
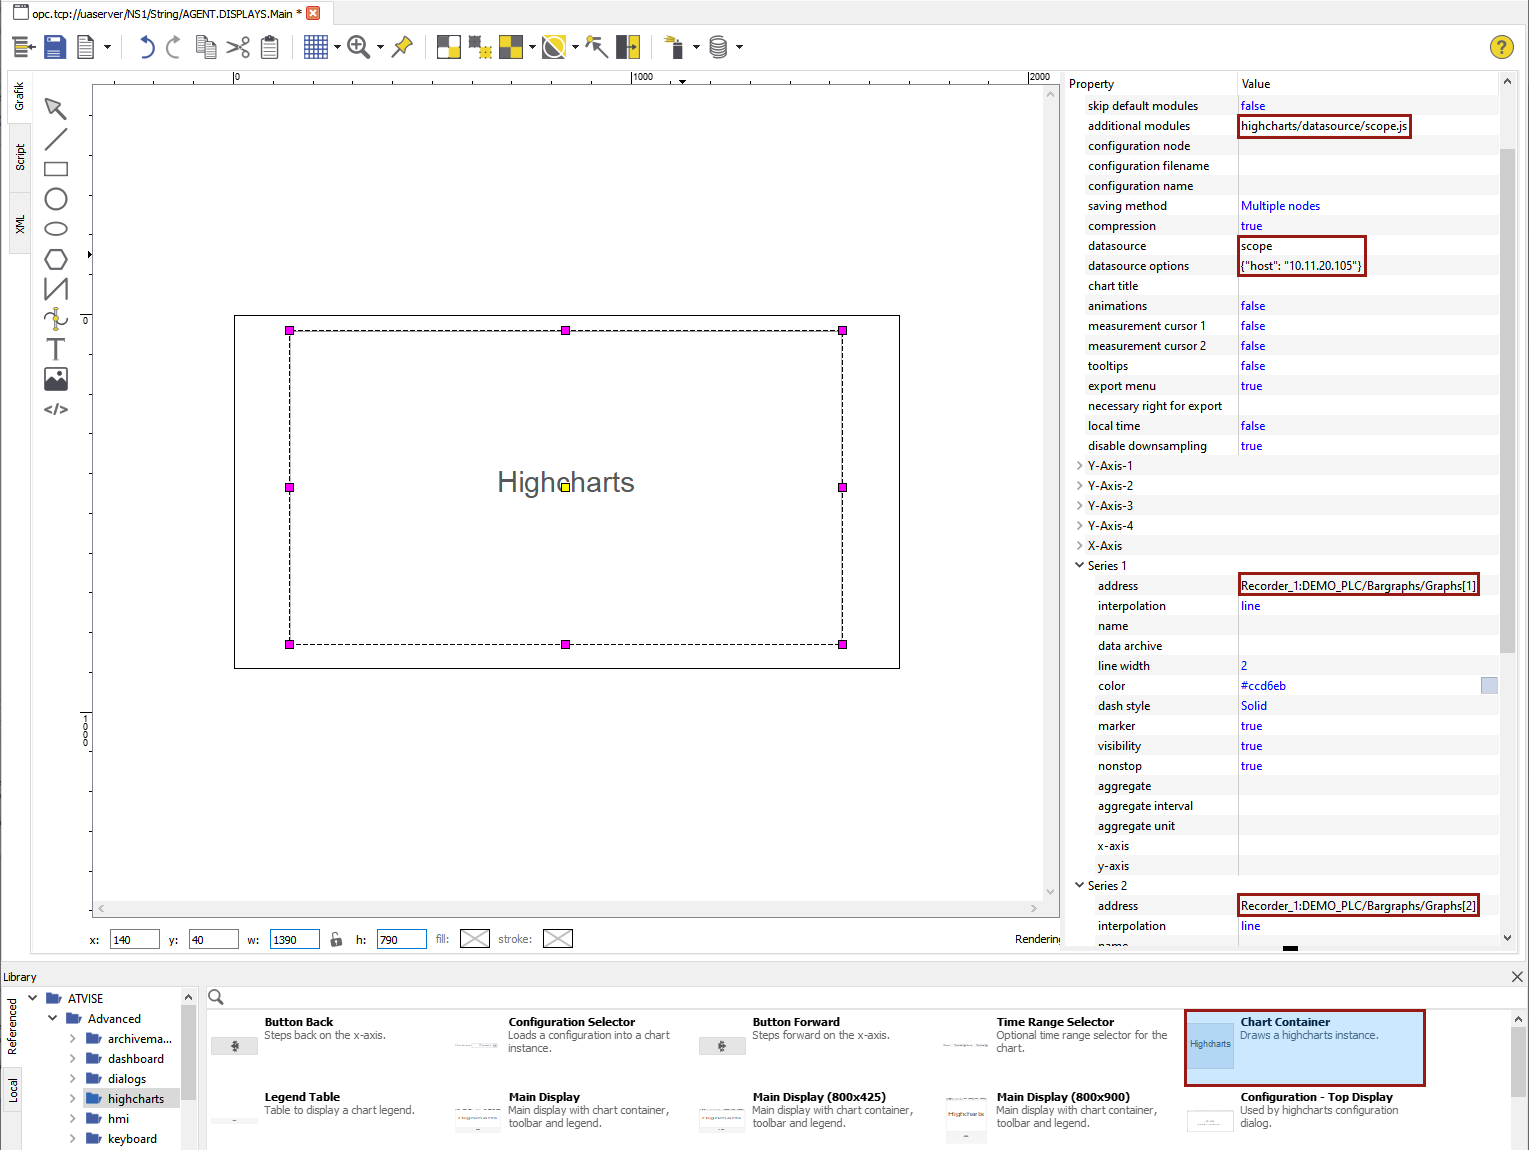
Chart Container configuration in builder
Insert Chart Container (ATVISE.Advanced.Highcharts.Chartcontainer) into the required display via drag & drop.
Select the Chart Container by a mouse click
Set the following parameters:
Additional modules: highcharts/datasource/scope.js
Hint
The webMI pro installer integrates the scope.js file into the builder.
Datasource: scope
Datasource options: The IP address of the controller. Optionally, you can also define the communication protocol (http or https) and port number. The address can be specified in the following ways:
[http[s]://]<IP address>[:<port>]
{"host": "[http[s]://]<IP address>[:<port>]"}
Series 1 > Address: <Recorder name>:<source path of variable>
Hint
One series corresponds to one channel
The source path of the variable can be taken from the Scope 3 tool of the SolutionCenter (see Channel tab - Source column in first picture).
Save the display and distribute the atvise project to the M1 controller
Open a web browser and the visualization
The highchart displays the configured signals while the Scope 3 recorder is sampling.
Using the highcharts Main Display
This section describes how to add the highcharts Main Display to a new display and configure and display it in the visualization.
builder:
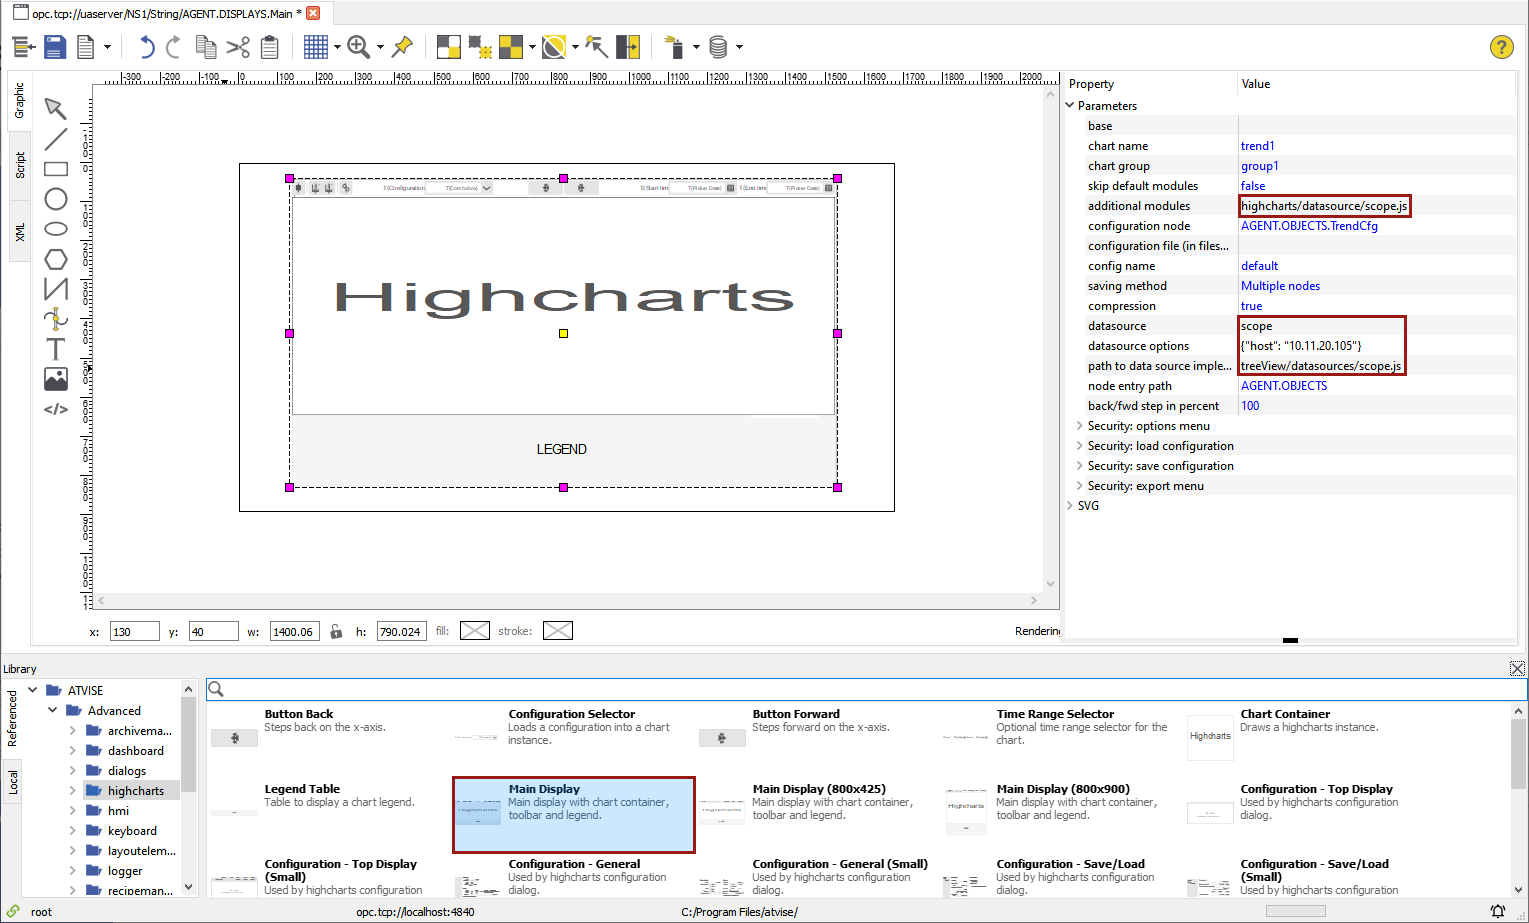
Main Display configuration in builder
Insert the Main Display (ATVISE.Advanced.Highcharts.Main Display) via drag & drop into the required display
Select the Main Display by a mouse click
Set the following parameters:
Additional modules: highcharts/datasource/scope.js
Datasource: scope
Datasource options: The IP address of the controller. Optionally, you can also define the communication protocol (http or https) and port number. The address can be specified in the following ways:
[http[s]://]<IP address>[:<port>]
{"host": "[http[s]://]<IP address>[:<port>]"}
path to data source implementation for tree view: treeView/datasources/scope.js
Save the display and distribute the atvise project to the M1 controller
Optional steps if the customized display shall be opened via the default display of the visualization:
Open the default display (Server ‣ <server name> ‣ DISPLAYS ‣ Default)
Select the button for opening the highcharts Main Display
Edit the target display parameter (under parameter group button 1) and specify the customized highcharts display
Save the default display
Visualization:
Open a web browser and the visualization
Click the "Settings" button (gears icon) to open the chart configuration
Go to the configuration view "General"

Chart configuration "General"
This view shows the settings configured in the atvise builder and allows to edit them.
Data source: scope
Advanced Option: The IP address of the controller. Optionally, you can also define the communication protocol (http or https) and port number. The address can be specified in the following ways:
[http[s]://]<IP address>[:<port>]
{"host": "[http[s]://]<IP address>[:<port>]"}
Click Quicksave to save changes
Go to configuration view "Data"
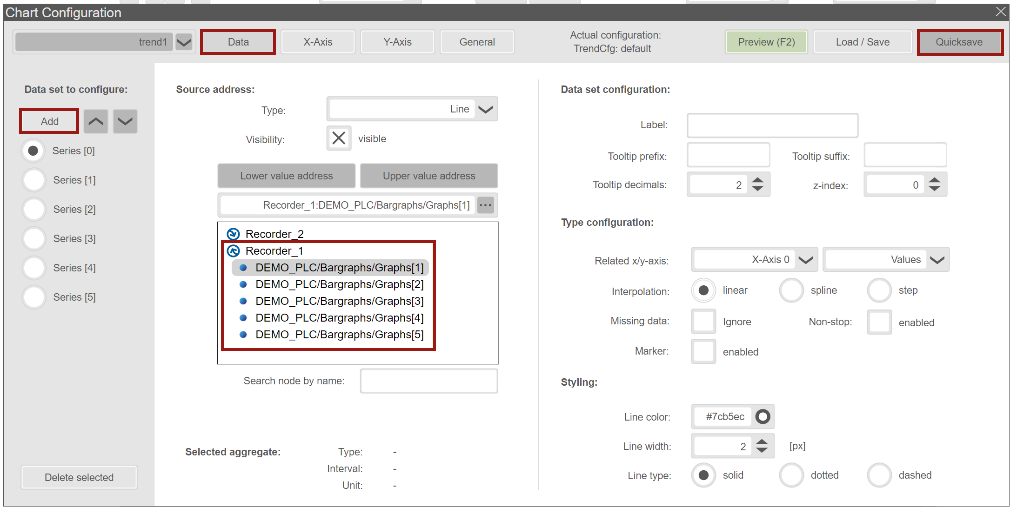
Chart configuration "Data"
Add the required channels to the chart configuration
Hint
All available recorders of the connected controller are displayed. The selectable channels of a recorder are listed by clicking on the respective recorder.
Click Quicksave to save the channel configuration
Close the chart configuration and view the recorded data
Adapt the displayed timespan by changing the start and end time.
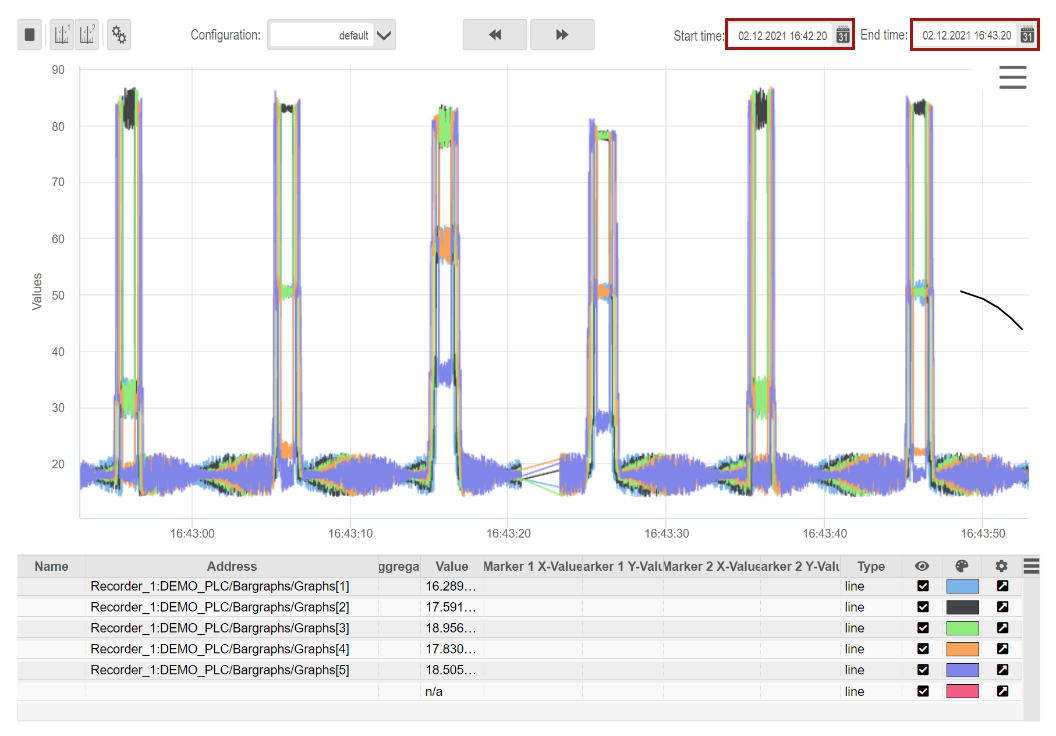
Visualization of Scope 3 real-time data in the highcharts Main Display