3 Draw a display and generate visualization
In this section, we will add a simple display to our project and generate the web visualization afterwards.
3.1 Adding a new display to the project
Right-click on the Servers ‣ DemoServer ‣ DISPLAYS ‣ MAIN folder.
Choose .
Now you can enter the desired display name. For our example, let us choose "TestDisplay1".
After acknowledging the display name by clicking OK, you will see an entry for the new display if you open the structure of the MAIN folder.
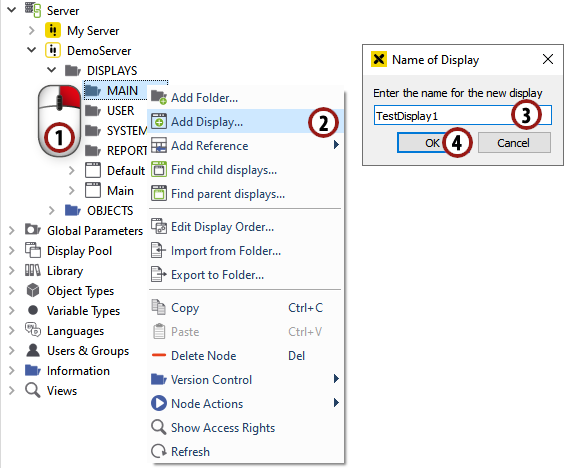
Adding a new display to the project
3.2 Editing the display and drawing simple elements
Double-click the new "TestDisplay1" entry to open the included graphics editor for this display.
Hint
This editor offers you many powerful tools to design the optimal display for your project. For detailed information see Editor functions.
For our example, we will simply add a rectangle and a circle to the display.
Click on the
 symbol to select the rectangle drawing tool.
Click somewhere in the drawing area, press down the left mouse button, move the mouse till the rectangle has reached the desired size, and release the button.
Click on the
 symbol to select the circle drawing tool.
Draw the circle the same way as described in step 3.
Click the
 symbol after you have finished the drawing interactions to save the display.
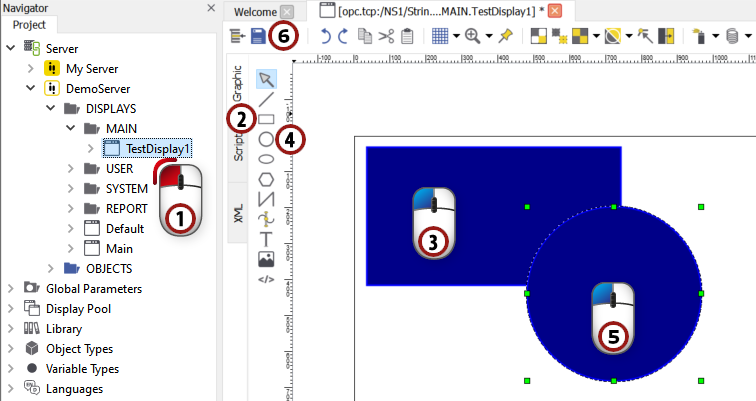
Drawing simple elements and saving the display
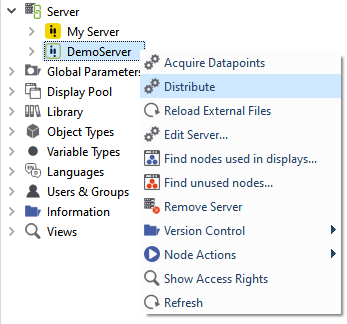
3.3 Generating a web visualization
Choose from the menu bar.
The visualization files will be generated and saved to the "Data Root Target" (configured in the server settings) after the process has finished.
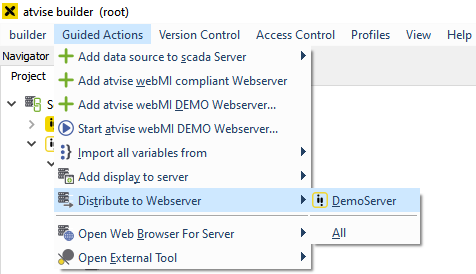
Generating a visualization
Hint
Another way to generate the visualization is by right-clicking on "DemoServer" and choosing .