Edit quick dynamics
Description
A "quick dynamic" (QD) is based on the atvise "simple dynamics" (SD) such as "On click, open a display" or "Change the color of the rectangle depending on the value of an address".
A QD can be applied to any element (e.g. a simple rectangle, a button, …).
QDs are used to prepare common functionality that is often needed in your project so that the user doesn't have to create the functionality step by step with SDs each time.
In the folder Library ‣ ATVISE ‣ Quick Dynamics, you can find all Quick Dynamics that we have prepared for you and that are ready to use (e.g. "Change Color by Node").
Hint
To create your own QD collection, please use the folder Library ‣ PROJECT ‣ Quick Dynamics. The "ATVISE" folder will be updated with new releases and you will lose all changes that you made there.
Texts in quick dynamics can be translated by using T{}. However, the translation is not possible if the respective quick dynamic is loaded by the index.htm (like Auto Reconnect or index).
Steps to create a quick dynamic
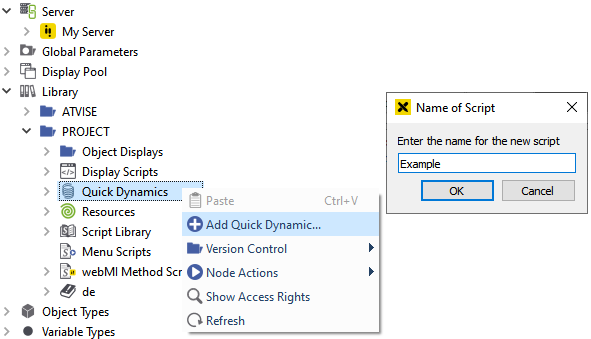
Right-click Library ‣ PROJECT ‣ Quick Dynamics and choose .
Specify a name and click OK.
Open the Quick Dynamics tree and double-click your QD: The script editor opens.
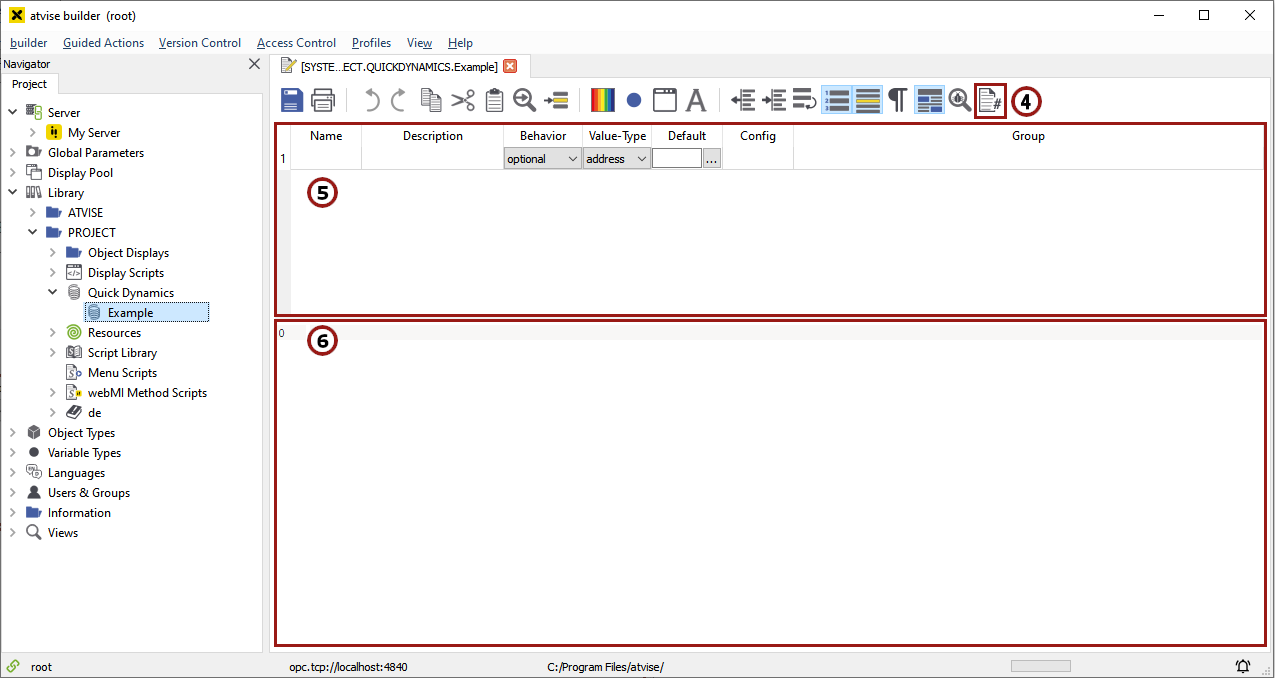
You can find the standard editor functions (Open, save,…) in the menu at the top of the script editor. The last button can be used to edit the "metadata" of your QD. You can define the title, description and an icon here.
Below the menu you can specify a list of parameters that will be passed on to your QD script.
The parameters are typed in by the user when he applies your QD to an element. Each parameter has a set of attributes:
Name: The name of the parameter (important to access the parameter in the script).
Description: Description of the parameter that will be shown to the user.
Behavior: You can specify if a parameter is optional, mandatory or hidden.
Value Type: This attribute defines the type of the parameter.
address – Allows to select an address from the system.
display – Allows to select a display from the system.
string
number
bool
color
enum – In the "Config" column, you can create a list of values separated with a ";", e.g. "Option A;Option B;Option C".
global
Hint
You cannot change these global parameters afterwards (neither in the QD's configuration dialog nor at runtime). However, it is possible to modify the content of the parameter by script. E.g.:
var x = "#ff0000";
webMI.callExtension("SYSTEM.LIBRARY.ATVISE.QUICKDYNAMICS.myQD", {"myGlobalParameter":x})
Default: You can specify a default value for the parameter.
Config: Used for the "enum" type (for description, see above).
Group: Used to display parameters in a group (e.g. parameter "x" and "y" in the group "coordinates").
After you have specified the parameters, you can start creating your script.
Quick Dynamic Example
Goal: Create a quick dynamic to add or subtract a number from the value of a source node and write the result to a target node.
The QD will be executed when the user clicks on an element.
First we create a new QD and name it "Calculate Example".

Now we open the QD.
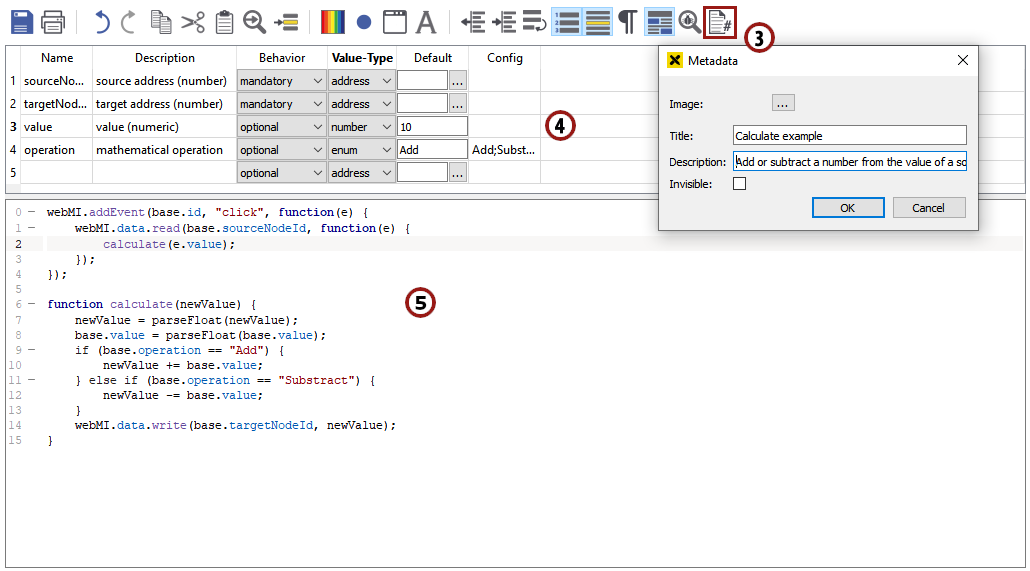
Start with editing the metadata:
Title: Calculate Example.
Description: Add or subtract a number from the value of a source node and write it to a target node.
Also, we will need some parameters (Name | Description | Behavior | Value type | Default | Config | Group):
sourceNodeID | source address (number) | mandatory | address | (empty) | (empty) | (empty)
targetNodeID | target address (number) | mandatory | address | (empty) | (empty) | (empty)
value | value (numeric) | optional | number | 10 | (empty) | (empty)
operation | mathematical operation | optional | enum | Add | Add;Subtract | (empty)
Important: All parameters have to be accessed in the script with "base.PARAMETER_NAME" (see example).
The next step is to write the script code (Hint: If you don't know the syntax, have a look at the section Client/Browserside scripting in our help or just create some simple dynamics and copy the script code).
We start with the "click" event:
webMI.addEvent(base.id, "click", function(e) {
    webMI.data.read(base.sourceNodeId, function(e) {
        calculate(e.value);
    });
});
As you can see, the "base.ID" parameter is available by default. You can always read the "ID" of the source element in this way.
Within the click function, we use
webMI.data.read()to read the current value from our source node.Then we pass the value ("e.value") on to the function calculate:
function calculate(newValue) {
    newValue = parseFloat(newValue);
    base.value = parseFloat(base.value);
    if (base.operation == "Add") {
        newValue += base.value;
    } else if (base.operation == "Substract") {
        newValue -= base.value;
    }
    webMI.data.write(base.targetNodeId, newValue);
}
The function calculate first uses the JavaScript default function "parseFloat" to ensure that our values are numeric.
Then we decide whether to add or subtract the value depending on the option that the user has chosen.
After we have made our calculation, the result "newValue" is written to our target node.
Test:
Create two numeric variables with value "0" in your system.
Create a new display. Draw a simple rectangle and a circle.
Select the rectangle and apply our "Calculate Example" QD to it.
A parameter dialog will appear which shows all parameters that we have specified for the QD.
Fill out the parameters (use "add" for the rectangle).
Now apply the dialog with the "OK" button.
Do the same for the circle, but choose "subtract" this time and type in "5" for the value.
Now drag & drop the two numeric variables to your display (the atvise default value display will appear).
Open your visualization and click the rectangle or circle: Now the target node should display "10" if you click the rectangle and "-5" if you click the circle.