Introduction
The entire atvise webMI visualization is based on open web standards. All individual displays are stored in the SVG (Scalable Vector Graphics) format and are delivered to the browser of your choice by the web server included in the atvise server.
Basically, every web browser that supports SVG, JavaScript and xmlhttp request should be able to display this visualization. To view a detailed up-to-date compatibility list, please visit https://www.atvise.com -> Compatibility List.
To view the visualization of your project, start a compatible web browser and call up the machine on which the atvise server is running. To do this, type in the IP address or the host name of this machine in the address bar of the browser.
Hint
If the atvise server is running on your local computer, you can start the visualization by typing in http://localhost.
Due to the interdependence between visualization and licensing, please note:
Hint
For information about the CCD licensing in atvise scada, see the section atvise scada CCD licensing.
User interface
atvise provides several default layouts for the visualization that can be selected after the first project start or via server settings (open the context menu with a right click on My Server and click the Edit Server… option). The layout "Advanced 1920 x 1080 (16:9)" is described as an example.
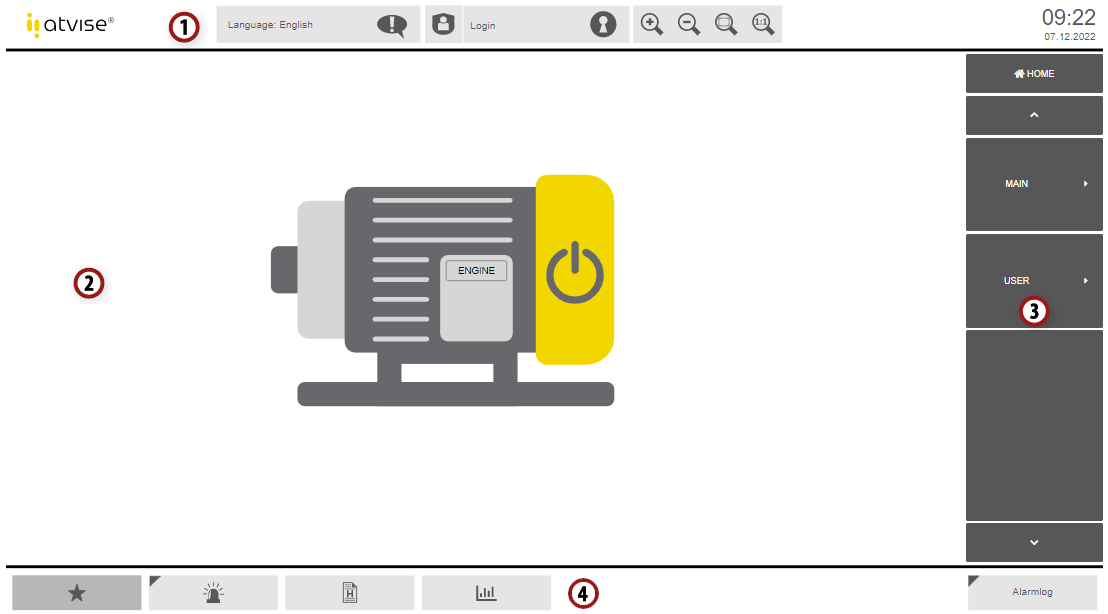
The user interface of the visualization is generally divided into the following areas:
1. Language, access control event log, login/logout, zooming
 Language switch
Allows to select another language. The order of displayed languages can be defined via "frame.languages" in the
webmicfg.jsfile. Access control event log
Opens the access control event log that shows notifications in case of insufficient user rights for specific actions.
 or
or  Login / Logout
Allows a user to log in or out. See also the chapter Authentication.
 Zoom in
Enlarges the zoom factor by 10%.
 Zoom out
Reduces the zoom factor by 10%.
 Zoom to area
Zooms to a selected area. To use this tool, first click on the "zoom to area" symbol, then drag a rectangle by clicking on two opposite corners of the area. Alternatively you can click and hold the mouse button on the forst corner, move the mouse to the other corner and release the mouse button.
Hint
You can change the visible part of a zoomed-in display by holding the Alt key and moving the content with the pressed mouse button.
 Zoom to origin
Sets the zoom factor back to 100%, the display will look the same as after opening it.
2. Display area
Shows the currently opened SVG display. The Main display is opened by default. It is possible to define custom start displays for logged in users (see user management.
3. Navigation
This area enables you to navigate through the visualization and open the respective display in the display area with a left mouse click. It shows the structure of folders (e.g. default folders MAIN, USER, etc.) and displays as defined in the atvise builder below Server ‣ My Server ‣ DISPLAYS. Refer to the Navigation chapter for further information.
4. Favorites, alarming, history list, highcharts, alarm log
 Favorites
Allows to add the current display to the favorites or open an already added display.
 Alarm list
Opens the alarm list.
 History list
Opens the history list.
 Highcharts
Opens the highcharts display.
 Alarm log
Displays information about alarm status changes.
Hint
A blinking red rectangle around the alarm log button indicates the existence of a currently unacknowledged alarm.