History list
Filter inputs
To filter the data, the following inputs can be set in the filter input area, where depending on the type different criteria are supported.

When the history list is opened, the advanced filters are hidden and can be shown by clicking the button Advanced filters.
The filter Type defines which types (Value, Event, Alarm, Aggregate) are included in the search. Following criteria can be used with all types:
- From
Start time.
- To
End time.
- Number of rows
Maximum number of rows to request.
Hint
By clicking on  you can select between three possible ways to specify the time range respectively the number of rows:
From - To – This is the default and allows you to specify start and end time.
From - Number of rows – You can specify a start time and a number of rows. You will get at most the specified number of rows starting with start time and going towards present.
Number of rows - To – You can specify an end time and a number of rows. You will get at most the specified number of rows, starting with the end time and going towards past.
In any case the given time is always the time of the occurrence of the historized entry (source time, alarm state change, …).
- Address
Address of the historized entry:
Type Value: NodeId
Type Alarm: Alarm condition
Type Event: Name of the event
Hint
You can select a data variable from your server by using the
 selector.
- Value
Value of the historized entry. Related to the attribute value for the types Value and Aggregate and to the alarm triggering value for the type Alarm. Not used for the type Event.
- Archive
Raw archive for values, aggregate archive for aggregates, event archive for alarms and events.
Additional for types Alarm and Event:
- Username
User who caused the historized entry.
- Message
Active/inactive text for alarms, event text for events.
- Min.-Severity
Minimum priority of the historized entry. Everything greater or equal than this priority will be returned.
For type Aggregate the desired aggregate function and interval can be set. Depending on the type of the server the selection of the aggregate is different:
atvise server – You can select one of the parameterized functions of all aggregate templates in the project.
Hint
Even though you directly select a function of an aggregate template, only the parameters aggregate function, interval and unit are used for the query. Because of this the server response can include results of other variables that use aggregate templates with the same combination of parameters.
webMI server – Aggregate function, interval and unit can be set to arbitrary values, because the webMI server is not able to tell the browser the list of supported aggregates.
Hint
To activate a filter, click the button Apply filter for archived data or activate the live checkbox for live data. If the live checkbox is activated, the filter cannot be edited. To edit the filter the checkbox has to be deactivated.
The type Aggregate cannot be filtered concurrently with any other type.
If the type Aggregate is selected it is not possible to switch to the live mode and specific filters (Aggregate, Interval) are shown.
If multiple types are selected, fields are only considered for entries which contains the respective field. E.g. a username will be ignored for entries of type Value.
Entries for the From time are always included while entries for the To time are always excluded.
For the filters Address, Username, Message and Value, the value of the input field must be contained in the attribute of the entry, an exact match is not required.
Since the given address must only be a substring of the result (and not an exact match), the corresponding access rights cannot be checked when filtering addresses. Therefore, in case of missing read permissions for the given address, no data is returned without displaying any permission error.
Data output
Clicking on the Apply filter button or activating the Live checkbox will send the query to the atvise server. The resulting data is listed in the table below the input area.
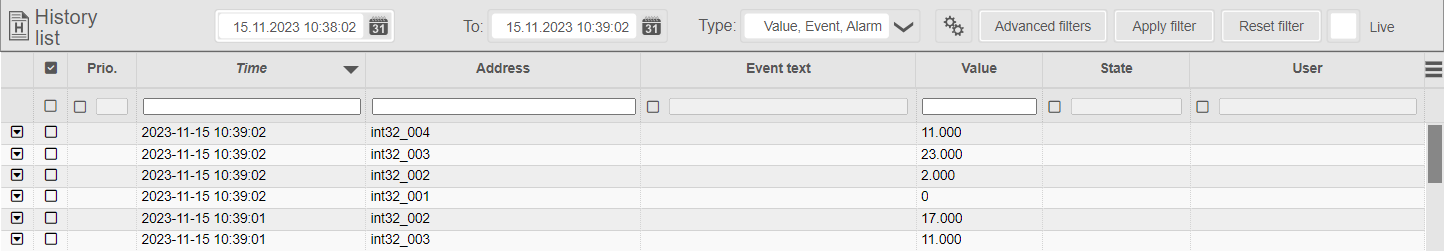
Columns of the history list
The returned data can be further filtered by using the input fields of the respective columns. The checkbox next to an input field allows to switch the filter mode. If the checkbox is active, a specific filter for the respective column can be entered. In this case, it is also possible to filter for empty fields, e.g. in order to find the user Anonymous. If inactive, all entries are displayed. The filter checkbox can be configured via filterCheck in the global list.
Information on how to personalize the history list can be found in the corresponding Object Display help. This list is based on the same table than the alarm list, for details about more features see also alarm list.
The list contains the following columns:
- Sev.
Severity of the historized entry (for alarms and events).
- Time
Time of the occurrence of the historized entry.
- Address
Address of the data variable which caused the historized entry.
Type Alarm: Alarmcondition
Type Value: NodeId
Type Event: Name of event
- Type
Type of the historized entry (Alarm, Event, Value).
- Message
Active/inactive text for alarms, event text for events.
- Value
Value of the historical entry (raw value, aggregated value or alarm triggering value).
- User
User who caused the historized entry (only for alarms and events).
There is also a smaller version of the history list, optimized for devices with small displays (e.g. tablets and mobile phones). This smaller version provides less options for filtering the query and by default shows a reduced number of columns.