4.4 Using simple dynamics
In this section we will take a look at how to create your own individual dynamics using the simple dynamics dialog.
4.4.1 Adding a text element, editing it and starting the simple dynamics dialog for it
In this section, we will directly display the value of a data variable in the visualization using the simple dynamic dialog.
Open "TestDisplay1" in the graphics editor as described in section 3.2.
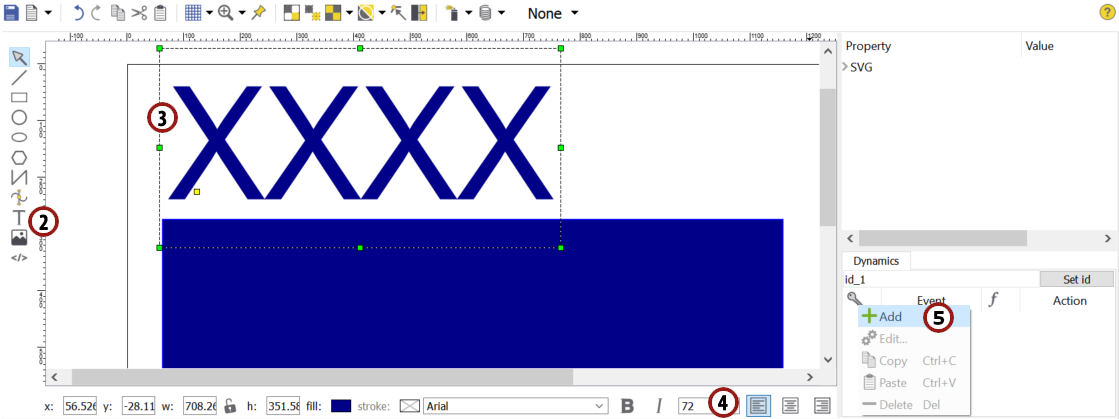
Add a text element to the test display.
Click somewhere in the drawing area and type in whatever you want to get a preview of how the text will look in the visualization.
Make sure that the text element is marked. Change the text size to 72 in the style area on the middle right side of the atvise builder interface.
Right-click "add" in the dynamics area on the bottom right of the atvise builder interface. The "Simple Dynamics" dialog will appear on your screen.
Hint
There are 3 ways in total to open the "Simple Dynamics" dialog. Each of them will open the very same dialog, so it's your choice:
You can right-click on the dynamics area as described above.
You also can double-click on the whitespace in the dynamics area.
The third way to use simple dynamics is by right-clicking on the element to which you want to add a dynamization and choosing "Add dynamics".
Adding a new text element and starting the "Simple Dynamics" dialog
4.4.2 The "Simple Dynamics" dialog
The "Simple Dynamics" dialog offers you a very powerful way to create individual dynamics with minimal effort.
You can create many different types of dynamics in four steps:

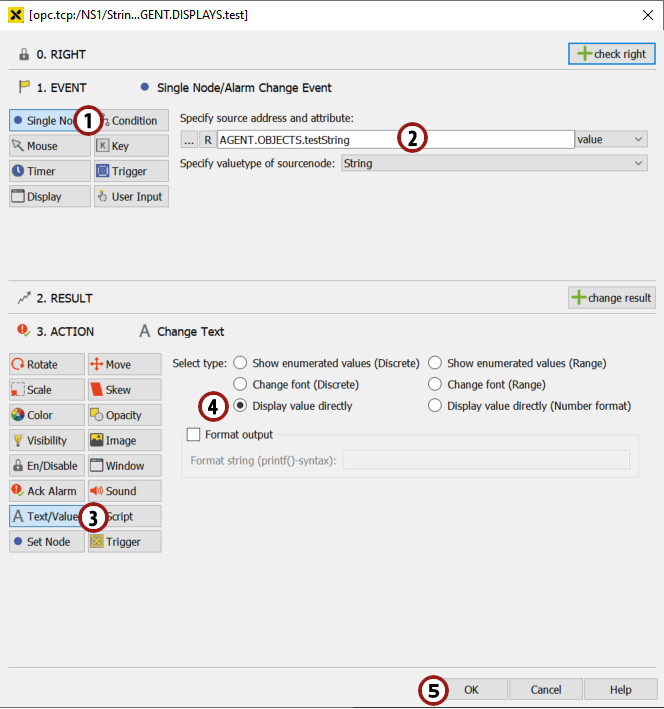
In this step you can check a user right which is then necessary to activate the dynamization. We don't need this for our current example.

In this step you can decide which event activates the dynamization.
In our case we want to react to the change of a data variable, so we choose
 from the possibilities on the left side.
Now we have to specify this data variable. Click on the
 symbol and choose "testString" from the list which appears.

In this step, you can change the result of the event. We don't need this for our current example.

In this step, you can define the action that will be executed when the event is triggered. For our example we will define the way the result is displayed in the visualization.
We want to display the value of the data variable directly, so we choose
 from the possibilities on the left side.
Check
 .
.Now that all the necessary information is entered, we can apply the dialog by clicking OK.
Adding dynamization to the text element using simple dynamics
Hint
Afterwards, you will see an entry for this dynamization in the dynamics list of this text element. To edit or view an existing dynamization, you can open the "Simple Dynamics" dialog for this entry by double-clicking on it.
4.4.3 Activating and viewing the dynamization
Now we want to view our dynamization in the visualization.
Save the display.
Open "TestDisplay1" in the browser of your choice (as described in sections 3.1., 3.3).
You will see that the random characters are replaced by the current value of the data variable "testString".
Change the value of "testString" several times as described in section 4.1.2 and look at how it is displayed in the browser.
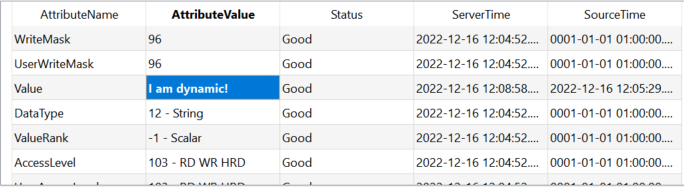
Change the value of the "testString" data variable …
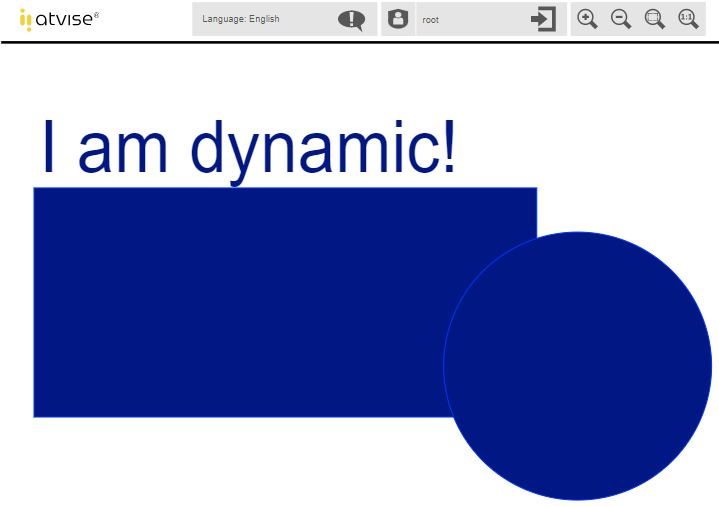
… and see how it is displayed in the browser.
4.4.4 Adding simple dynamics to change the color of an element
In this section, we want to change a graphic attribute of one of our elements in dependence on a data variable. Let's say we choose the circle in our "TestDisplay1" and we want its color to depend on the value of our "testBoolean" data variable. If the value is true, we want to fill the circle with green, if the value is false, we want to fill it with red.
In the first step, we have to mark the element to which we want to add a dynamization. Go back to the graphics editor, click somewhere in the circle (which we drew in section 3.2) to mark it and start the "Simple Dynamics" dialog by right-clicking
 .
.The event we want to react to is a change of "testBool", so we choose this variable as described in section 4.4.2.
Now that we have an event to react to, we have to define the action that is to be executed. We want to change the color of our circle, so we choose
 from the possibilities on the left side.
We want to react to discrete values, so we choose
 from the type selection list.
If the value is true, we want to fill the circle with green, so we choose a green color for this condition by clicking
at the right side of the condition list.Furthermore, we will add a second condition by clicking on
 .
.We change the "Value" column to false and select a red color by clicking on
.Now that all the necessary information is typed in, we can apply the dialog by clicking "OK".
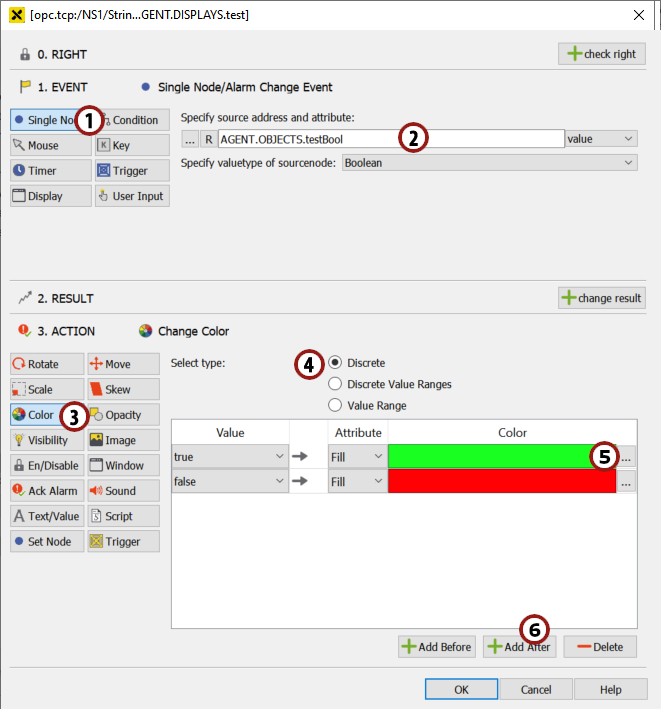
"Change Color" dialog
4.4.5 Activating and viewing the dynamization
Save the display.
Open "TestDisplay1" in the visualization. If you have already opened this display, please reload it.
You will see that the color of the circle now shows the state of the "testBoolean" variable.
Change the value of "testBoolean" several times and look at how the color changes in the browser.
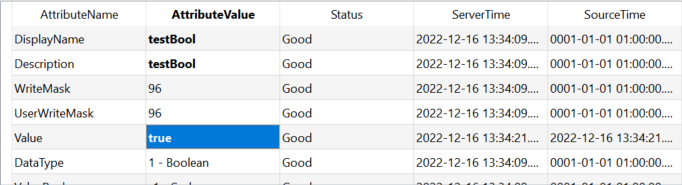
Change the value of the "testBool" data variable …
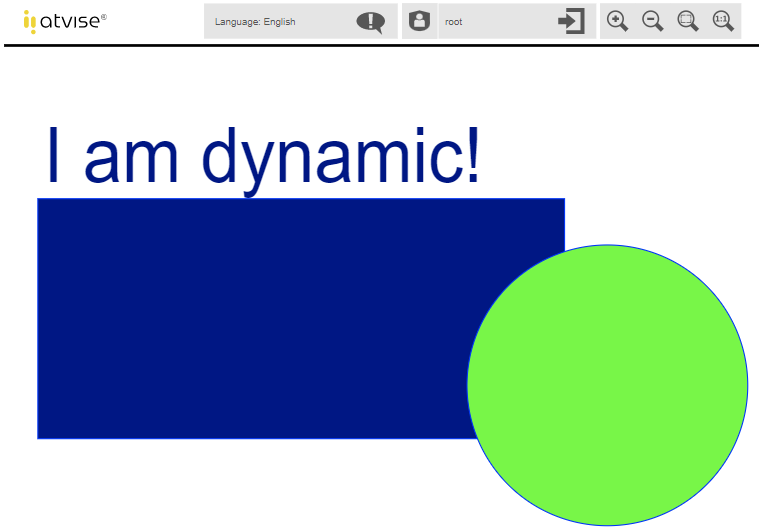
… and see how it is displayed in the browser.