3 The first display
After covering some basics, we will now proceed to an interaction with the atvise builder. In this section we will add a simple display to our project and view it in the visualization afterwards.
Hint
The access control allows to define which data and functions shall be accessible for a user in the builder as well as in the visualization. Anonymous users have very restricted access by default. Therefore, there may occur permission issues within the visualization when proceeding with the tutorial. Enable the following setting to avoid this:
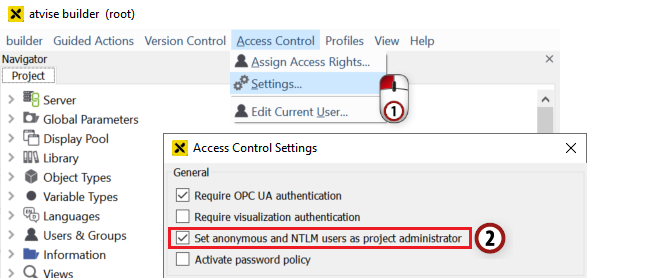
As a result, anonymous users will have the same rights as a project administrator and no visualization login is necessary. Otherwise, you must log in as user root.
3.1 Adding a new display to the project
Open the "Servers -> My Server -> Display" folder, then right-click on the MAIN menu entry.
Choose "Add Display" from the list which appears.
Now you can type in the desired display name. For our example, let's choose "TestDisplay1".
After acknowledging the display name by clicking "OK", you will see an entry for the new display if you open the structure of the MAIN menu.
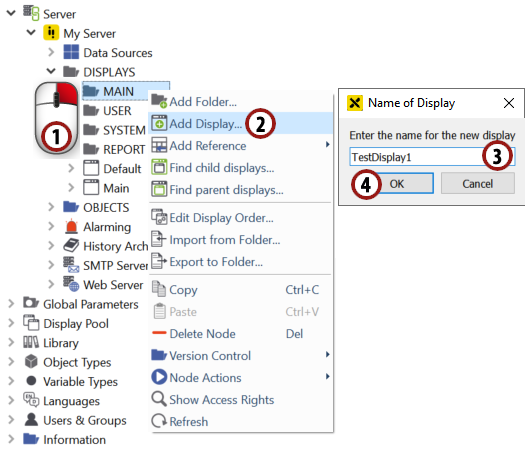
Add a new display to the MAIN menu
3.2 Editing the display and drawing simple elements
Double-click the new "TestDisplay1" entry to open the included graphics editor for this display.
Hint
This editor offers many powerful tools to design the optimal display for your project. For detailed information see Editor functions.
For our example, we will simply add a rectangle and a circle to the display.
Click on the
 symbol to select the rectangle drawing tool.
Click somewhere in the drawing area, press down the left mouse button, move the mouse till the rectangle has reached the desired size, then release the button.
Click on the
 symbol to select the circle drawing tool.
Draw a circle the same way as described in step 3.
Click the
 button symbol after you have finished the drawing interactions to save the display.
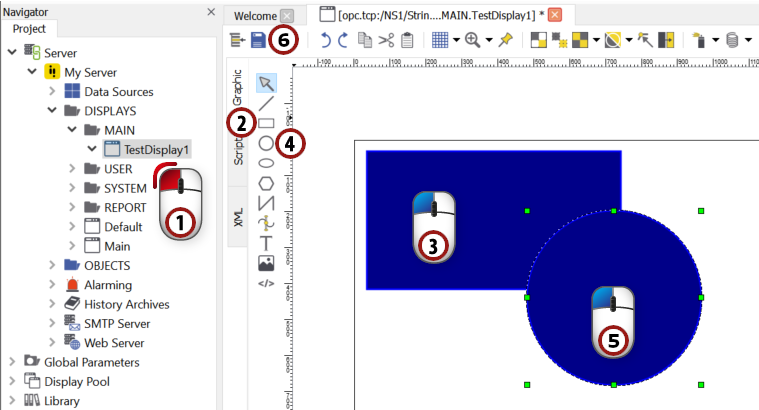
Draw a rectangle and a circle, save the display and …
Hint
Also try to zoom in the drawing area using the mouse wheel.
3.3 Viewing the display in the web visualization
Now you can call up the new display in the visualization. Start a browser of your choice.
Call up the visualization by entering the URL of the machine on which the atvise server is running. If this machine is your local machine, type in "http://127.0.0.1/" to open the visualization.
Open the display by choosing "TestDisplay1" from the main menu.

… view it in the browser of your choice.
Attention
If you change a display after you have already launched the visualization, reload the current page to be sure that you see the updated version.
Attention
If you encounter any problems with viewing the visualization, please clear your browser cache and reload the page (especially if you have used previous atvise versions before).